USD/JPY drops through 142.00 as US Dollar sells off
- The USD/JPY dumped on Wednesday as the USD gets pinned to the floorboards.
- Broad-market risk appetite is betting on rate cuts from the Fed.
- Japan Retail Trade figures due early Thursday.
The USD/JPY fell nine-tenths of a percent on Wednesday as the market leans into bets that the Federal Reserve (Fed) will get pushed into a faster pace of rate cuts in 2024, with some investors expecting rate cuts to begin as soon as next March.
The Fed’s policy pivot in December saw the US central bank agreeing with markets that rate cuts would likely be coming in 2024, with the Fed’s dot plot of rate expectations seeing up to three cuts for a combined 75 basis points in rate reductions through the end of 2024. Markets promptly ran far ahead of the Fed’s own outlook, and money markets are pricing in upwards of six rate cuts for a combined 160+ basis points in rate cuts through next year.
Forex Today: No support for the Dollar
The broad-market rally sparked by the Fed’s pivot continues to pin the needle into risk-on territory, and attempts by several Fed officials to walk the market back from lopsided bets on rate cuts have so far gone unnoticed.
Japanese Retail Trade figures for November are due early Thursday, forecast to tick upwards from October’s 4.2% to 5% for the year through November.
Thursday’s latest weekly print of US Initial Jobless Claims will be the key data focus this week, with markets expecting a slight increase from 205K to 210K new jobless benefits seekers for the week ending December 22 versus the 205K from the week before.
USD/JPY Technical Outlook
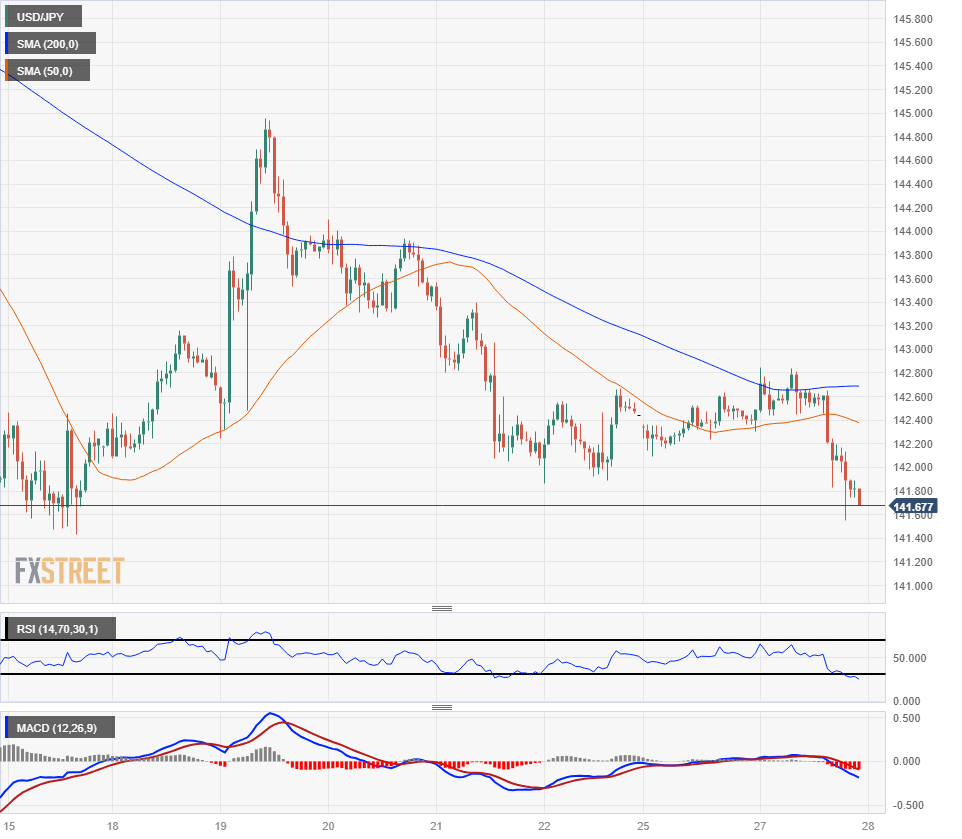
The USD/JPY has slipped through recent consolidation after a rejection from the 200-hour Simple Moving Average (SMA) near 142.70, tumbling through the 142.00 handle and testing fresh weekly lows near 141.60.
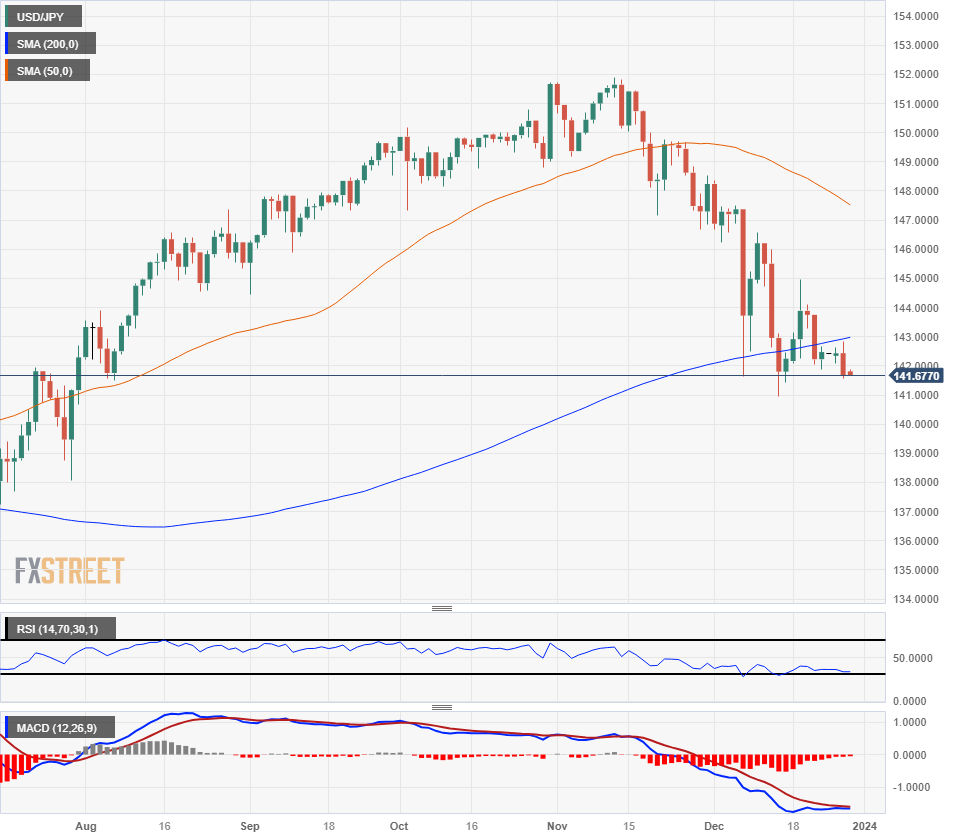
The US Dollar’s decline against the Yen is dragging the pair down through the 200-day SMA, but thin action has the pair hung up in rough action, and short momentum remains limited on the daily candlesticks.
The USD/JPY’s near-ter ceiling is sitting at the 200-day SMA near 143.00, with the 50-day SMA accelerating into a bearish pattern and descending towards 147.00.
USD/JPY Hourly Chart

USD/JPY Daily Chart

USD/JPY Technical Levels