EUR/GBP jumps to highs in over a month as bulls take charge
- The EUR/GBP is trading near 0.8695 showing an uptick of 0.25%.
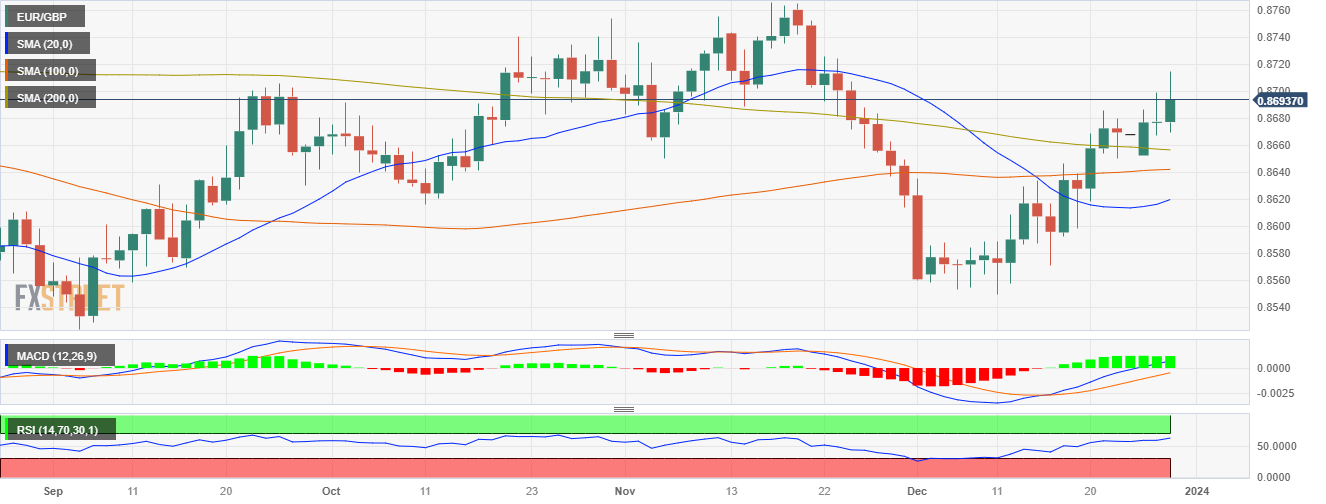
- Positive signals of the daily RSI and the rising trend in MACD's histogram allude to an increasing buying drive.
- Bull strength is palpable from the pair's position defiantly above the main SMAs.
- Four-hour chart indicators hint at diminished bullish momentum.
In Thursday's session, the EUR/GBP is trading at 0.8695, posting a modest gain of 0.25%. The daily chart indicates a bullish trend with the buyers firmly in control, gaining valuable ground. However, the four-hour chart suggests a slight stagnation as the indicators have turned flat, and the earlier bullish momentum has noticeably eased off.
Looking at the daily chart indicators, the positive inclination in the Relative Strength Index (RSI) and the upward trend of the Moving Average Convergence Divergence (MACD) with its increasing green histogram hint towards a dominant buying momentum. The overall bullish bias is further confirmed by the pair's position above its 20-day, 100-day, and 200-day Simple Moving Averages (SMAs).
Shifting the focus to the shorter time frame, the four-hour chart paints a contrasting picture. Following a period of bullish momentum, indicators have leveled off, and the buying sentiment seems to have cooled down a bit. The Relative Strength Index (RSI) on the four-hour chart is flat but remains in positive territory, suggesting a slight slowdown in the buying momentum. Similarly, the Moving Average Convergence Divergence (MACD) shows green bars that are rising, yet the bullish momentum appears to have waned.
Support Levels: 0.8675, 0.8665 (200-day SMA), 0.8640 (100-day SMA).
Resistance Levels: 0.8700, 0.8750, 0.8800.
EUR/GBP daily chart
