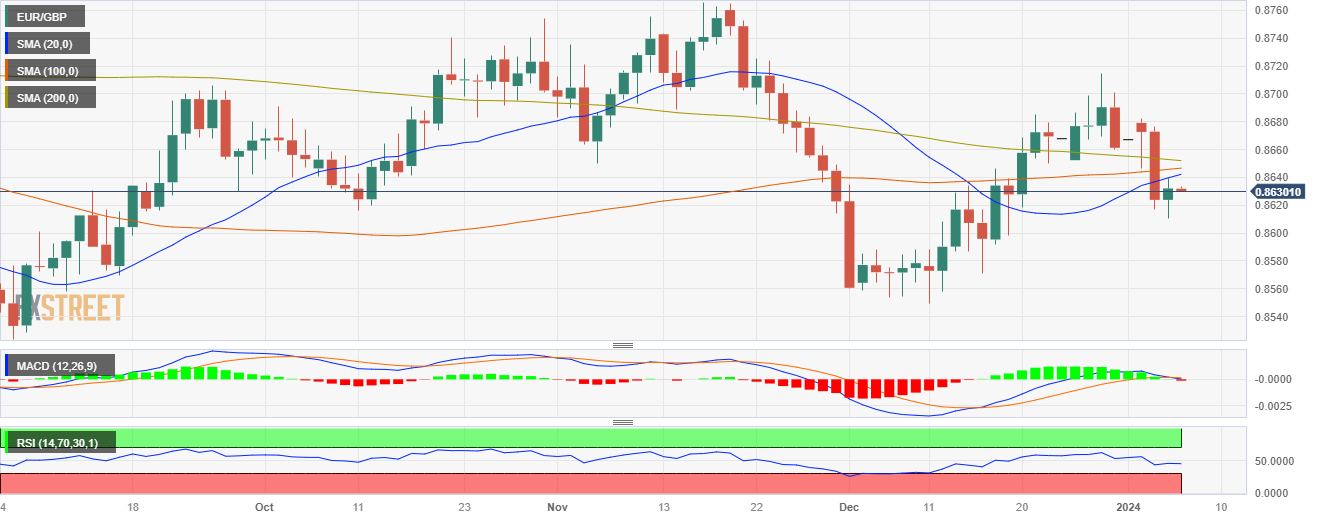
EUR/GBP trades with gains and consolidating Wednesday’s losses, eyes on bearish convergence
- The EUR/GBP currently stands at 0.8630, marking a slight gain of 0.20%.
- The RSI and MACD on the daily chart suggest that bears are taking a breather.
- The pair remains below key SMAs, reflecting a broader selling bias.
In Thursday's session, the EUR/GBP was recorded at 0.8630, gaining 0.20% with a peak at 0.8640. The pair demonstrated neutrality, leaning towards bearish on the daily chart, with bears taking short respites after Wednesday's downswing of 0.50%. Meanwhile, the four-hour chart outlook remains negative despite the brief recovery.
The technical indicators on the daily chart reveal a particularly unfavorable situation for the bulls. From the larger perspective, the pair is lodged beneath the 20, 100, and 200-day Simple Moving Averages (SMAs), which seem to converge towards the 0.8650 area to perform a bearish crossover. This signals that the sellers maintain a robust grip over the broader scenario, and in case the crossover comes into fruition, more downside may be incoming. Despite revealing a positive incline, the Relative Strength Index (RSI) lingers in the negative territory. This suggests a lack of buying strength despite the recovery, while the Moving Average Convergence Divergence (MACD) is still in negative territory.
Switching to the shorter-term perspective, mirrored in the four-hour chart, the overall seller dominance becomes more pronounced. The indicators persist in their negative stance, with the four-hour RSI showing a descending slope within the negative area, further reinforcing the bearish momentum. The four-hour MACD, too, mirrors this bearish sentiment with a series of declining green bars. Despite the bear's action taking a brief respite, the substantial downward movement of 0.50% on Wednesday illustrates that the bears still hold considerable power. It underscores a short-term technical scenario that is heavily swayed towards more selling.
EUR/GBP Technical Levels
EUR/GBP Daily chart
