Kiwi cycles on Thursday amidst pre-NFP market churn, NZD/USD circles 0.6250
- NZD/USD shuffles in place as investors jockey for position ahead of Friday’s US NFP.
- Early Thursday saw risk appetite take a step higher on China data beats.
- A surge in labor preview data is giving traders cause for pause.
The NZD/USD kicked into an early intraday peak of 0.6286 in the first half of Thursday’s trading, propped up by Chinese Services Purchasing Managers’ Index (PMI) figures beating expectations, but a surge in US labor and jobless claims sees investors pulling back to familiar midranges ahead of Friday’s US Nonfarm Payrolls (NFP labor print.
China’s Caixin Services PMI rebounded to 52.9 in December, hurdling over the forecast uptick from November’s 51.5 to 51.6. Coupled with China’s forecast beat in the Manufacturing component of the Caixin PMIs, Asia market session risk appetite was planted firmly in risk-on mode.
The US ADP Employment Change for December jumped unexpectedly to 164K, easily clearing the forecast 115K and hurdling over November’s 101K ADP jobs additions (revised slightly lower from 102K).
US Initial Jobless Claims also beat expectations, showing 202K new jobless benefits seekers for the week ended December 29 compared to the forecast 216K and dropping even further away from the previous week’s 220K (revised upwards slightly from 218K).
Friday’s US NFP is currently forecast to step down from November’s 199K to 170K in December, and December’s annualized Average Hourly Earnings growth is expected to tick down slightly from 4.0% to 3.9% MoM.
NZD/USD Technical Outlook
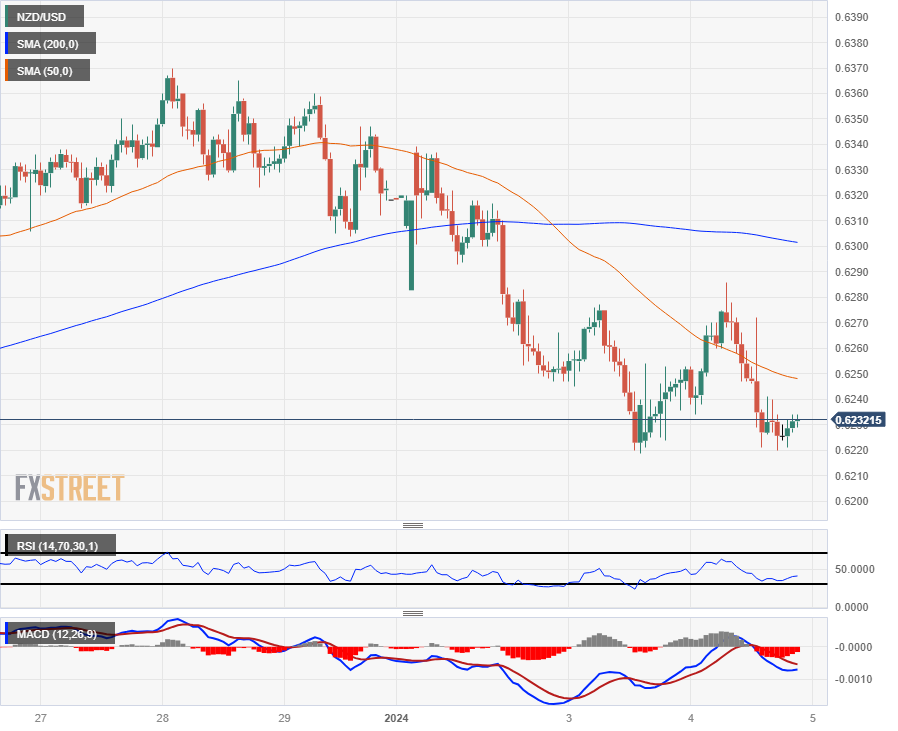
The Kiwi’s up-and-down action on Thursday sent the pair towards the 0.6300 handle before markets reserved direction, dragging the NZD/USD back into the week’s bottom bids near 0.6220. The Kiwi continues to trade on the low side of the 200-hour Simple Moving Average (SMA), which is declining into the 0.6300 price level and acting as a near-term technical ceiling.
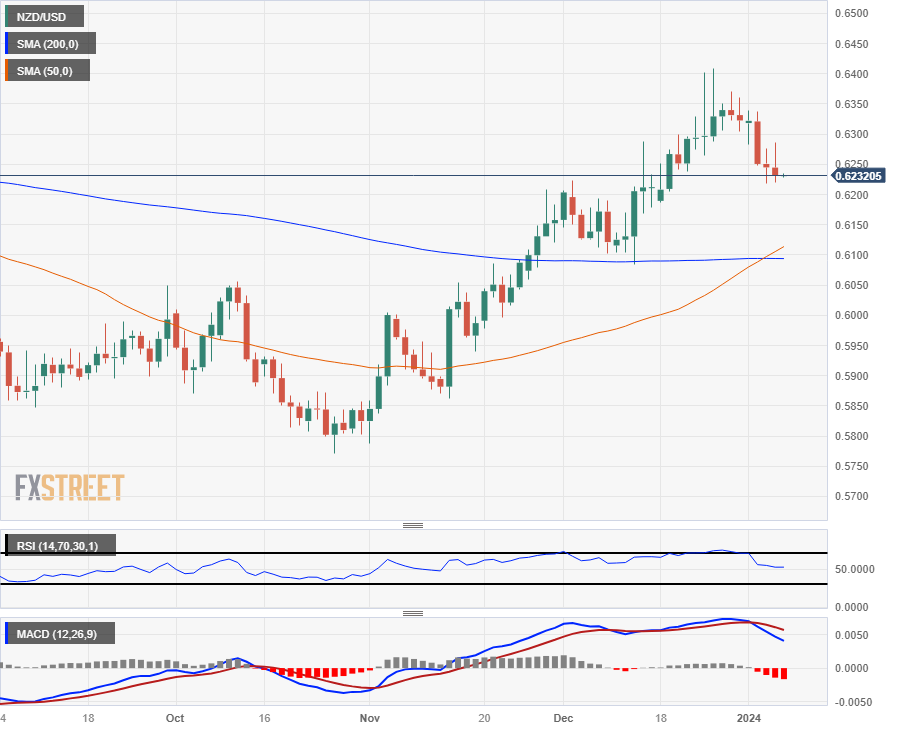
A slim decline at Thursday’s close leaves the Kiwi closing down or flat for a sixth consecutive day, and the NZD/USD is still down nearly 3% from December’s peak bids at 0.6410. Looking further out, additional declines will be set for a technical challenge from the 50-day and 200-day SMAs confirming a bullish cross near 0.6100.
NZD/USD Hourly Chart

NZD/USD Daily Chart

NZD/USD Technical Levels