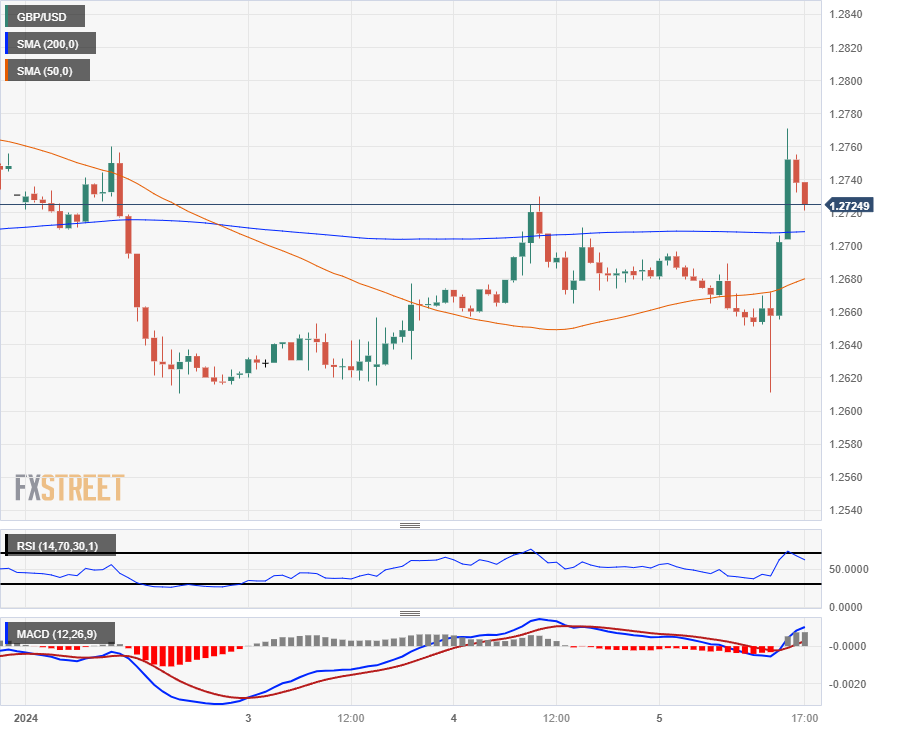
GBP/USD tests a new high for 2024 at 1.2771 post-NFP blitz
- The Pound Sterling climbed over the Greenback after markets surged in the NFP aftermath.
- US jobs additions easily cleared expectations, but revisions loom ahead.
- US data dominates Friday, UK looks ahead to GDP and output figures next Friday.
The GBP/USD climbed into a new high for the year at 1.2771 after markets broadly went risk-on after the US Nonfarm Payroll (NFP) data release surged above median forecasts, adding 216K new jobs in December. The NFP print handily trounced market expectations of 170K. Still, November saw a steep revision from 199K to 173K, with even further revisions to October’s already-revised 150K, bringing it down to just 105K.
Despite revisions continuing to plague key datasets, markets surged on the NFP forecast-beater, pushing the US Dollar broadly lower and sending the Pound Sterling to a new 2024 high.
US Average Hourly Earnings for the year through December also beat expectations, climbing from 4.0% to 4.1% versus the forecast tick down to 3.9%, and the US Unemployment Rate also beat the street, holding steady at 3.7% against the forecast increase to 3.8%.
See More: US Nonfarm Payrolls rise by 216,000 in December vs. 170,000 expected
Earlier Friday, UK Halifax Housing Prices rebounded for the annualized fourth quarter, climbing 1.7% after the previous quarter’s -0.8% backslide (revised up slightly from -1.0%). UK data was strictly low-impact and barely moved the needle as markets were bracing for NFP at the time.
Coming up next week will be BRC Like-For-Like Retail Sales on Tuesday, and then a clear data docket from the UK until next Friday’s Manufacturing & Industrial Production, as well as UK GDP figures.
US data will again feature heavily next week, with US Consumer Price Index (CPI) figures for December printing on Thursday, as well as Producer Price Index (PPI) and the Michigan Consumer Sentiment Index for January both printing on Friday.
Pound Sterling price this week
The table below shows the percentage change of Pound Sterling (GBP) against listed major currencies this week. Pound Sterling was the strongest against the Japanese Yen.
| USD | EUR | GBP | CAD | AUD | JPY | NZD | CHF | |
| USD | 0.94% | 0.04% | 0.66% | 1.44% | 2.51% | 1.12% | 0.94% | |
| EUR | -0.80% | -0.74% | -0.14% | 0.65% | 1.57% | 0.34% | 0.09% | |
| GBP | -0.06% | 0.74% | 0.63% | 1.38% | 2.54% | 1.08% | 0.82% | |
| CAD | -0.66% | 0.10% | -0.45% | 0.76% | 1.85% | 0.45% | 0.25% | |
| AUD | -1.46% | -0.66% | -1.42% | -0.80% | 0.90% | -0.34% | -0.57% | |
| JPY | -2.55% | -1.57% | -2.45% | -1.67% | -0.90% | -1.24% | -1.67% | |
| NZD | -1.14% | -0.34% | -1.09% | -0.47% | 0.32% | 1.23% | -0.24% | |
| CHF | -0.88% | -0.09% | -0.83% | -0.19% | 0.58% | 1.62% | 0.27% |
The heat map shows percentage changes of major currencies against each other. The base currency is picked from the left column, while the quote currency is picked from the top row. For example, if you pick the Euro from the left column and move along the horizontal line to the Japanese Yen, the percentage change displayed in the box will represent EUR (base)/JPY (quote).
GBP/USD Technical Outlook
It’s been a down-then-up week for the Pound Sterling, kicking off 2024 with broad gains against the majority of the GBP’s major currency peers. As markets wind down towards the Friday closing bell, the Poun Sterling finds itself up over two and a half percent against the Yen this week, with a 1.4% gain against the Aussie and 1.1% against the Kiwi as the Antipodeans slump.
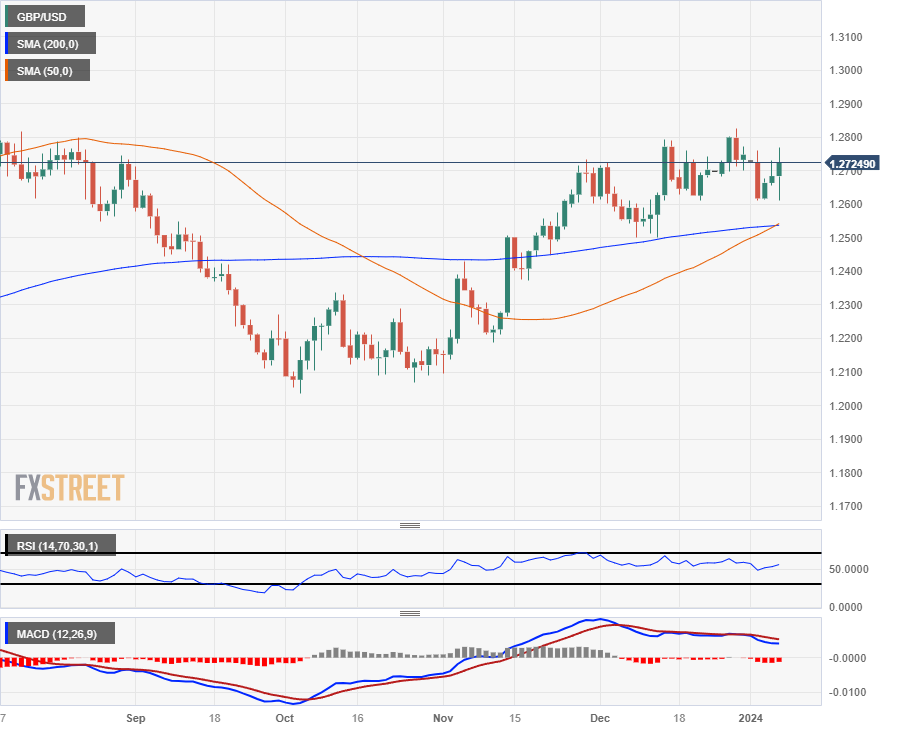
The only contender taking wind out of the GBP’s sails was the US Dollar itself, keeping mostly flat on the week and strapping the GBP/USD to a tight range around the 1.2700 handle.
GBP/USD bids remain constrained within easy reach of the 200-day Simple Moving Average (SMA), and a rough near-term consolidation range is baking into the daily candlesticks.
GBP/USD Hourly Chart

GBP/USD Daily Chart

GBP/USD Technical Levels