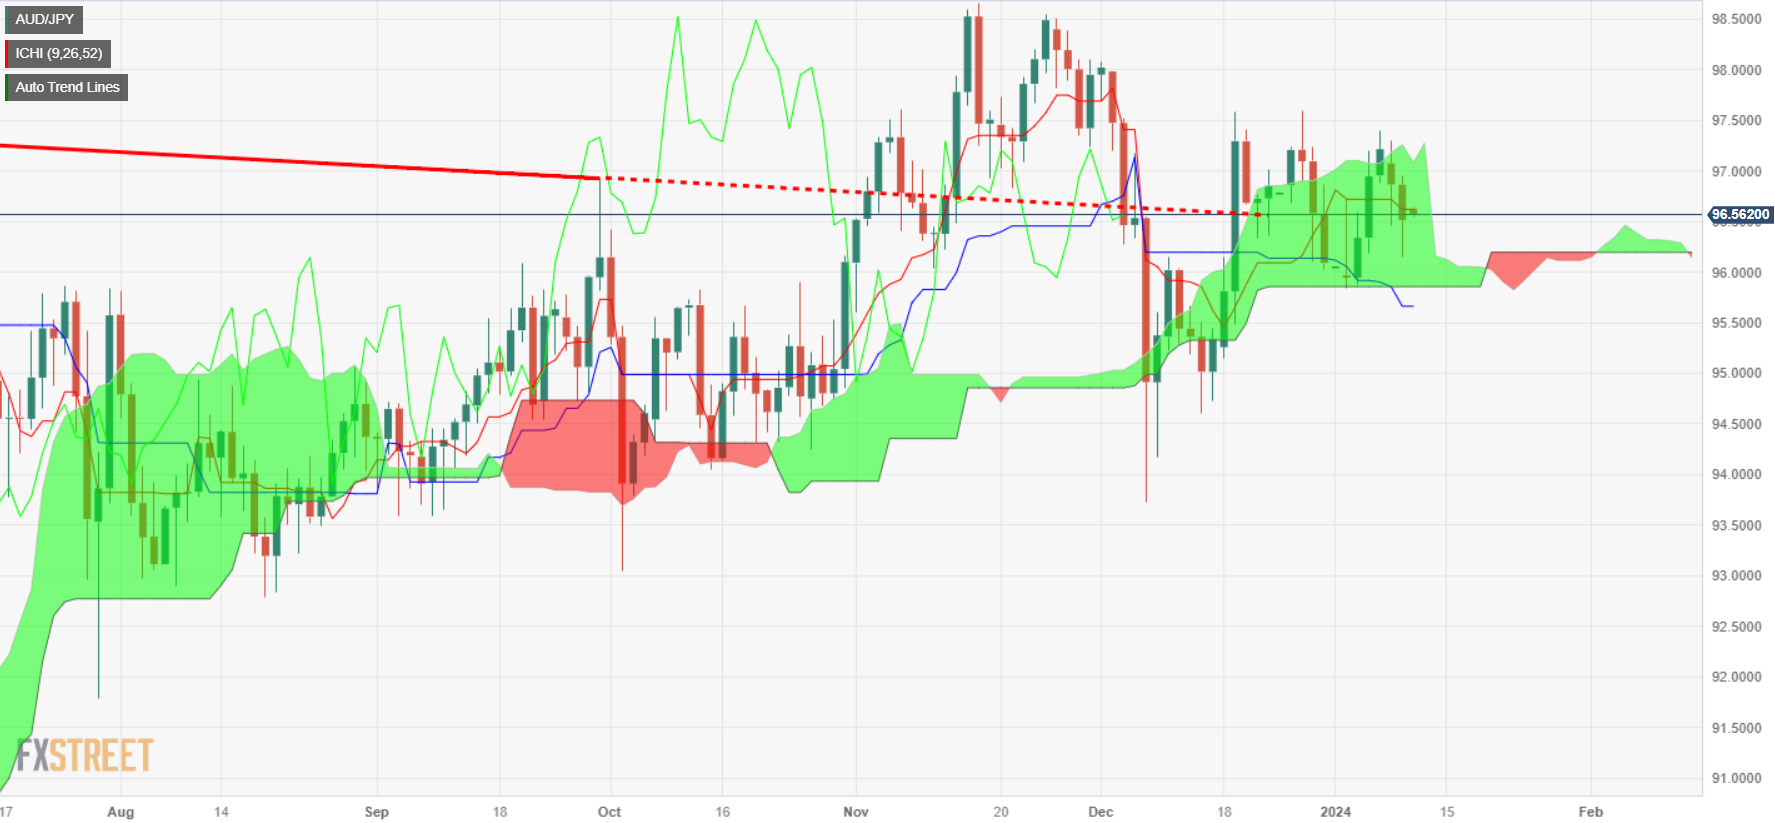
AUD/JPY Price Analysis: Slides further inside Ichimoku Cloud stays below 97.00
- AUD/JPY's continued downtrend reflects risk-off mood and strength in safe-haven currencies, falling 0.32% on Tuesday.
- Market focus on upcoming US inflation data, with implications for Fed's rate path and broader market sentiment.
- Technical analysis suggests neutral bias; key levels to watch include resistance at 97.00 and support at 96.14 and 96.00.
The Aussie Dollar (AUD) extended its losses against the Japanese Yen (JPY) for the second straight day, as risk appetite took a toll, while safe-haven currencies posted decent gains. Therefore, the AUD/JPY lost 0.32% on Tuesday, and as the Wednesday Asian session began, it traded at 96.54, down by 0.04%.
Fundamentally speaking, traders are awaiting the release of the latest inflation report in the United States (US), which will most likely provide clues to Federal Reserve (Fed) officials to lay the path for the year. Meanwhile, two policymakers crossing the wires on Monday suggested the current interest rate level is appropriate, and further easing is expected toward the end of the year.
A higher inflation reading could trigger a repricing of a less dovish Fed by the futures market, hence shifting sentiment sour and boosting safe-haven peers. Otherwise, the AUD/JPY could edge higher.
From a technical standpoint, the AUD/JPY is neutrally biased, though at the brisk of breaking crucial resistance levels at 97.00, followed by the confluence of a downslope resistance trendline and the 97.20 figure. Once cleared, that could open the door to challenging 98.00.
On the flip side, if buyers fail to reclaim 97.00, that could exacerbate a drop toward the bottom of the Ichimoku Cloud (Kumo). But AUD/JPY sellers must reclaim the January 9 low of 96.14, followed by the 96.00 mark, and the bottom of the Kumo at 95.80. Once broken, the Kijun-Sen is up next at 96.54.
AUD/JPY Price Action – Daily Chart

AUD/JPY Technical Levels