US equities broadly closed lower on Tuesday, NASDAQ ekes out a small gain as investors blink
- US equity indexes closed mostly in the red as the risk rally draws to a close.
- Risk appetite is struggling in the week following last Friday’s 2024.
- 2023’s last-quarter rally drew to a close as equities struggle in January.
US major equity indexes closed mostly lower on Tuesday with tech stocks leading the charge down the charts, though the NASDAQ composite index managed to squeeze out a minor gain while the rest of the indexes declined heading into a hefty midweek reporting window.
Tuesday saw 113 companies drop earnings reports either throughout the day or after the closing bell, but investors are broadly twisting in place, pulling back slightly from equities ahead of Thursday’s US Consumer Price Index (CPI) inflation print.
Investors were knocked off increased expectations of a faster pace of rate cuts from the Federal Reserve (Fed) after last Friday’s Nonfarm Payrolls (NFP) saw drastic downside revisions to previous prints despite a bumper reading for the most recent dataset, and market bets of the first Fed rate cut coming as soon as March are beginning to recede.
The Dow Jones Industrial Average (DJIA) fell 0.42% on Tuesday, shedding 157.85 points to close at $37,525.16, while the Standard & Poor’s major equity index fell 7.04 points to close down 0.15% at $4,756.50.
The Russell 2000 equity index slid a full percentage point, losing nearly 21 points to close at $1,98.04. The NASDAQ composite, meanwhile, bucked the trend to end Tuesday up a scant 0.09%, climbing just under 14 points to end the day at $14,857.71.
S&P 500 Technical Outlook
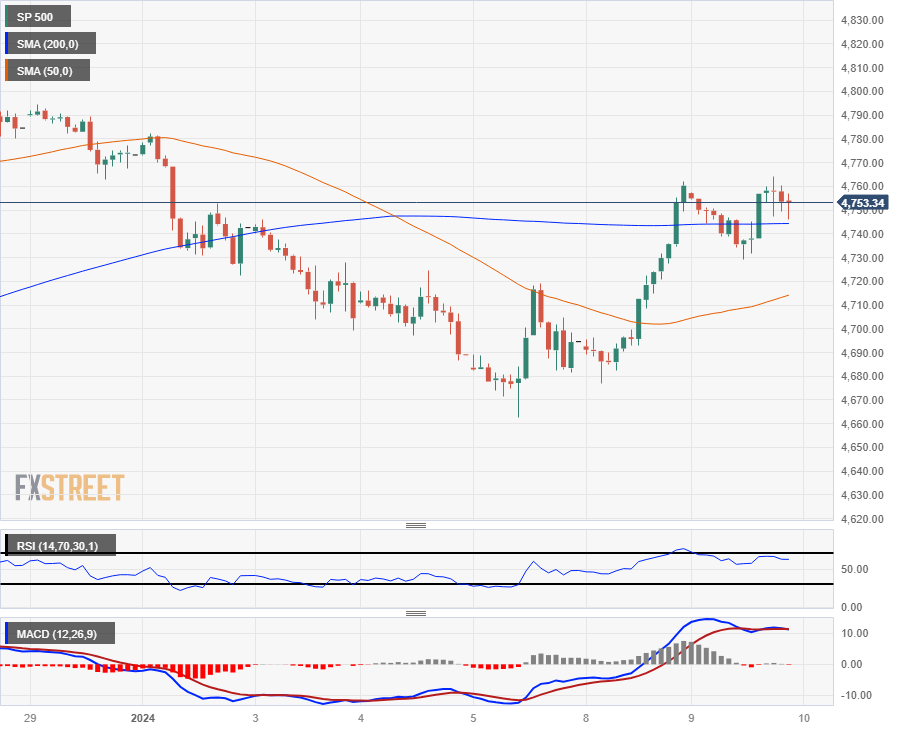
The S&P 500 skidded to a halt after Monday’s hopeful gains, getting hung up on the 200-hour Simple Moving Average (SMA) near $4,755, and near-term momentum is draining away as investors get snagged near $4,760.
Despite near-term declines, the S&P 500 remains well-bid, trading just below the $4,800 handle on daily candlesticks and remains up over 16% from late October’s bottom bids near $4,100.
S&P 500 Hourly Chart

S&P 500 Technical Levels