AUD/USD declines into near-term lows around 0.6680 despite Aussie Retail Sales beat
- The Aussie lost ground on Tuesday, paring away intraday gains.
- Broader markets are favoring the US Dollar heading into the midweek.
- This week hinges on US CPI inflation figures due on Thursday.
The AUD/USD slid back into recent lows on Tuesday, paring back Wednesday’s limited bounce as the Australian Dollar (AUD) shrugged off an upside beat in Australian Retail Sales. The US Dollar (USD) saw broad-market uptake on the day as investors adjusted their risk profile heading into the midweek.
Australia’s Retail Sales and Building Permits both beat expectations
Australia’s Retail Sales in November climbed 2% MoM, well above the 1.2% forecast and rebounded from October’s -0.4% decline, which saw a downside revision from -0.2%. Australian Building Permits also beat forecasts, printing at 1.6% in November, well back from October’s 7.2% (revised down slightly from 7.5%) but still above the market’s -2.0% forecast.
Australian Building Permits likewise beat the street, showing 2% growth in November versus the forecast 1.2%. October’s Building Permits were revised slightly lower from 7.5% to 7.2%.
US Data was thin on Tuesday, and markets will be broadly turning focus towards Thursday’s US Consumer Price Index (CPI) inflation figures as investors look to draw a bead on future Federal Reserve (Fed) rate cuts. Last Friday’s Nonfarm Payrolls disappointed market participants hoping for a faster, deeper pace of rate cuts in 2024, as healthier jobs data makes it harder for the Fed to get pushed into a rate cut cycle.
AUD/USD Technical Outlook
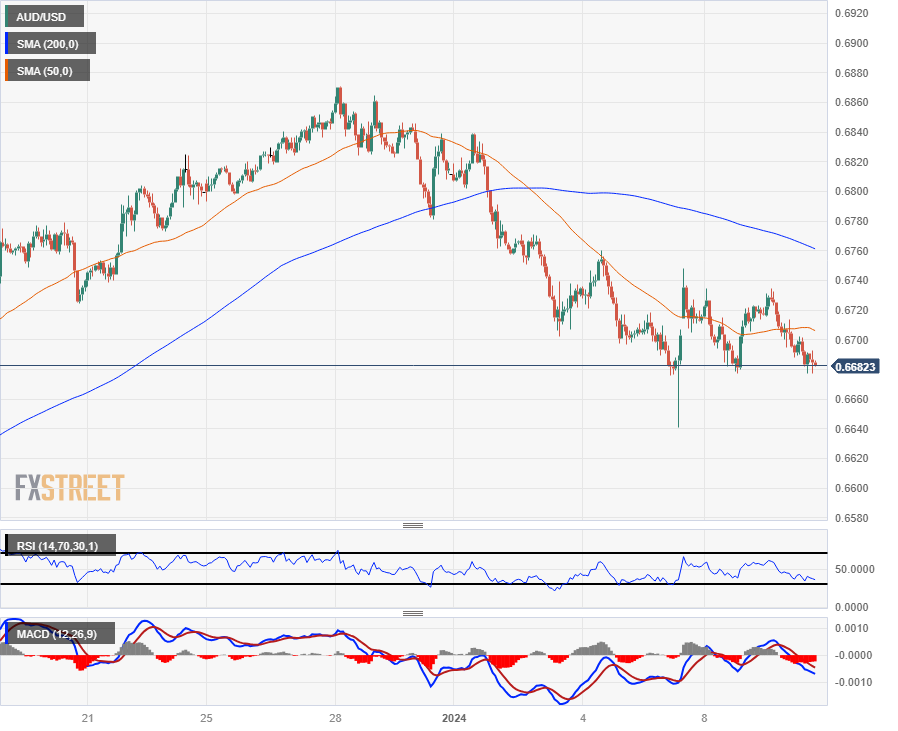
The AUD/USD has settled back into familiar near-term lows near 0.6680 as intraday action gets capped underneath the 200-hour Simple Moving Average (SMA) near 0.6760. The Aussie is down 2.75% against the US Dollar from late December’s peak of 0.6871.
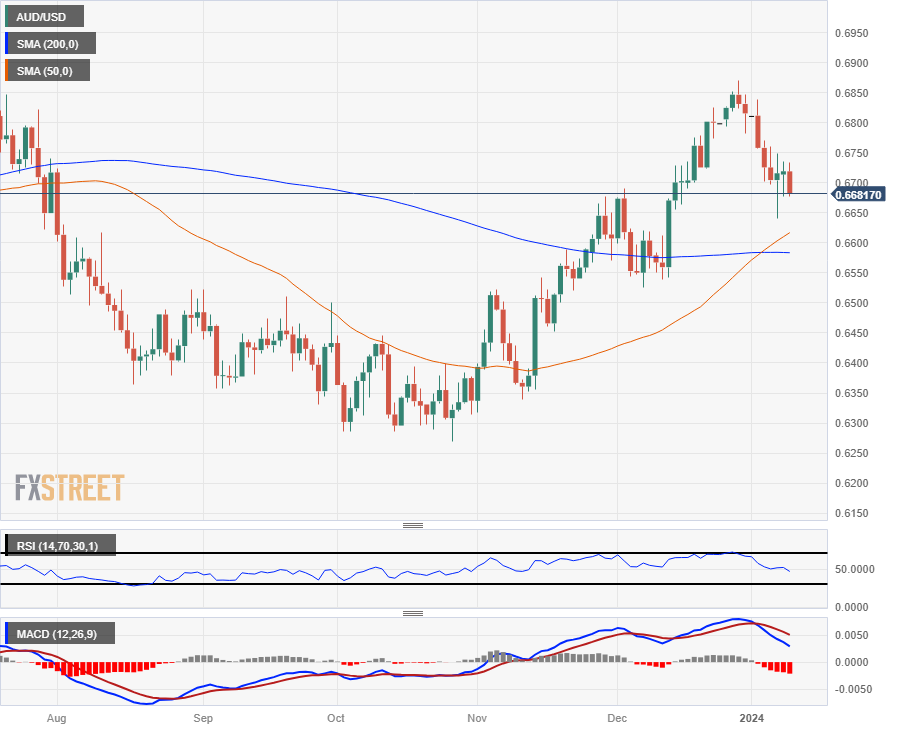
The AUD/USD’s near-term decline has the pair getting dragged back towards the 200-day SMA on daily candlesticks, approaching the 0.6600 handle as price action descends into a technical support zone following a bullish crossover of the 50-day and 200-day SMAs.
AUD/USD Hourly Chart

AUD/USD Daily Chart

AUD/USD Technical Levels