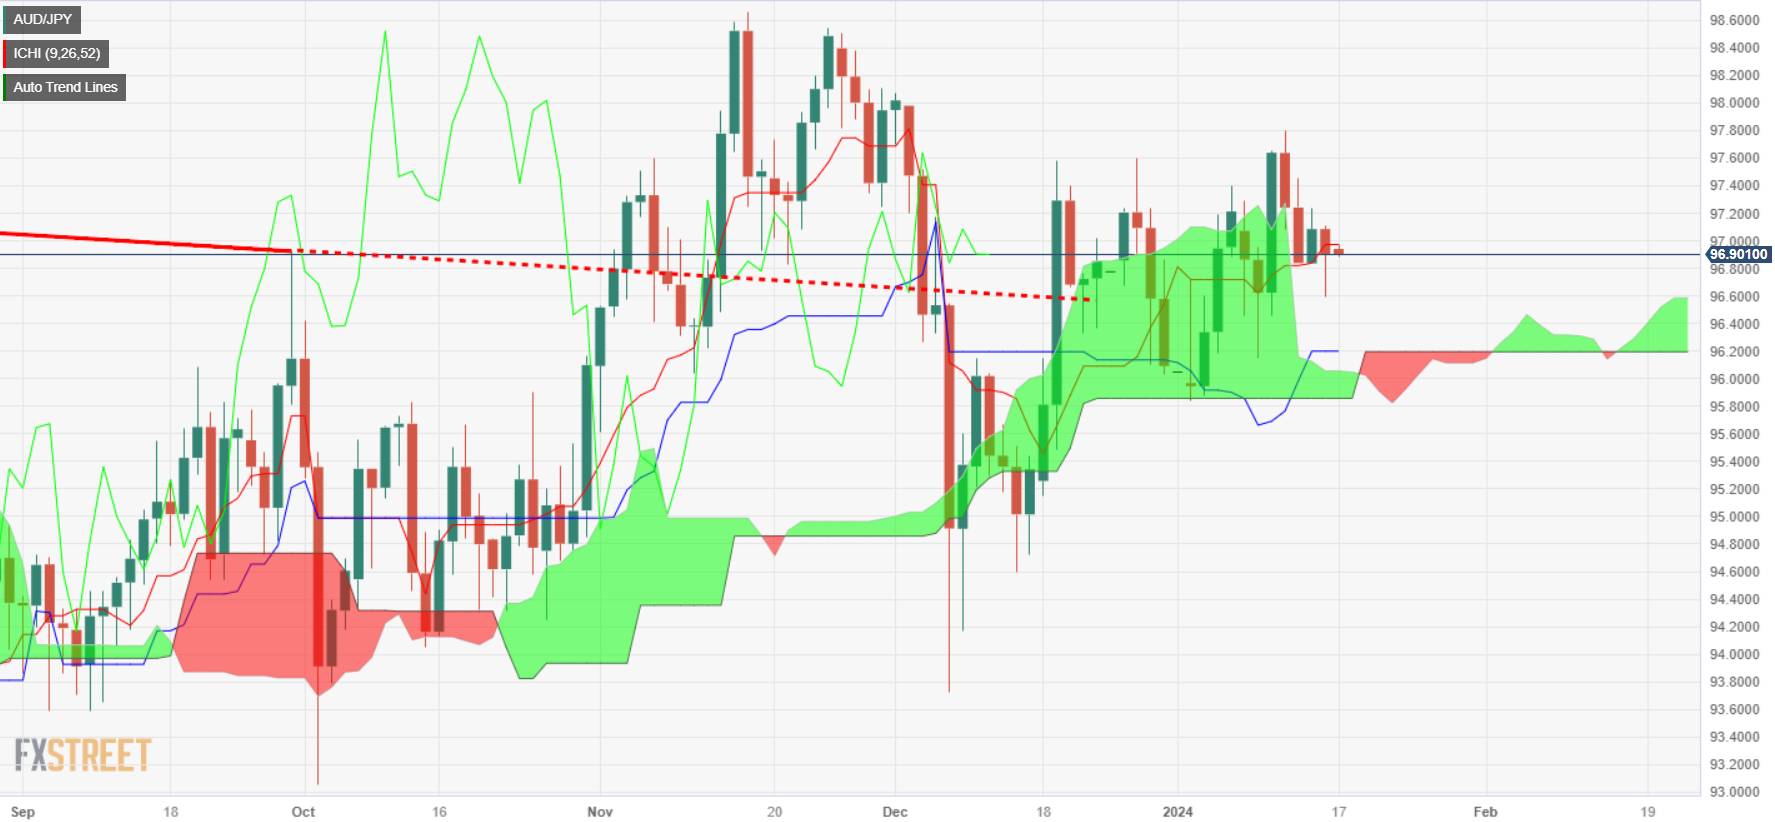
AUD/JPY Price Analysis: Registers modest losses, but remains upward biased as hammer emerges
- AUD/JPY falls to four-day low at 96.58, rebounds slightly amid weak risk appetite and Wall Street losses.
- Technical analysis: AUD/JPY has an upward bias but faces resistance near 97.00/10; breach could lead to more gains.
- Sellers target below 97.00, eyeing Senkou Span A and January 16's 96.58 low, with further downside to 96.00.
The AUD/JPY printed modest losses on Tuesday, as risk appetite took its toll as worldwide central bank policymakers pushed back against rate cut expectations. Therefore, Wall Street ended the session with losses, while risk-perceived currencies, like the Aussie Dollar (USD) and the New Zealand Dollar (NZD), registered losses vs. safe-haven peers. The pair is trading at 96.89 as Wednesday’s Asian session begins.
The daily chart suggests the pair is biased upward, though refreshed at a four-day low at 96.58 before paring its earlier losses. That formed a hammer, which usually is a bullish signal, though AUD/JPY is facing stir resistance at a two-month-old downslope resistance trendline that passes at around 97.00/10, which, once cleared, could pave the way for further upside.
In the outcome of reclaiming that level, buyers' next stop would be the January 11 high at 97.79, followed by the 98.00 figure. A breach of the latter will expose last year’s high at 98.58.
Conversely, if sellers keep prices below the 97.00 threshold and drag the spot price toward the confluence of the Senkou Span A and January 16 lows of 96.58, they could remain hopeful of aiming toward the 96.00 figure. Though on its way toward that level, they must conquer the Kijun-Sen and the Senkou Span B convergence at around 96.18/14.
AUD/JPY Price Action – Daily Chart

AUD/JPY Technical Levels