Gold Price Forecast: XAU/USD faces downward pressure influenced by US strength and high US yields
- The XAU/USD exhibits a strong downward trend, moving near the $2,025 level.
- The US Dollar measured by the DXY Index rose to its highest since mid-December.
- Higher US yields are also driving demand away from the US Dollar.
In Tuesday's trading session, the XAU/USD showcased a significant downward trajectory, trading near the $2,025 mark. This downward movement is predominantly attributed to the strengthening US Dollar and higher US yields. With the US economy showing resilience, precious metals such as gold XAU are witnessing downward pressure but as long as dovish bets on the Federal Reserve (Fed) remain high, the downside is limited.
The Federal Reserve closely observes Core inflation, which unexpectedly picked up in December. In addition, they also monitor the labor market, which showed strong figures in the last month of 2023, with job creation and earnings accelerating and Unemployment declining. While the Fed officials keep a cautious tone as an overheated economy may threaten their fight against inflation, the markets are confident that the easing cycle will begin in March, and those dovish bets may limit the downside for the metal. As for now, the CME FedWatch Tool suggests that the probabilities of cuts in March and May are high, above 50%.
Presently, US Treasury yields are up. The 2-year rate is 4.20%, the 5-year rate is 3.90%, and the 10-year yield is recorded at 4%. Higher yields drove attention to the US dollar as it tends to attract foreign investors.
XAU/USD levels to watch
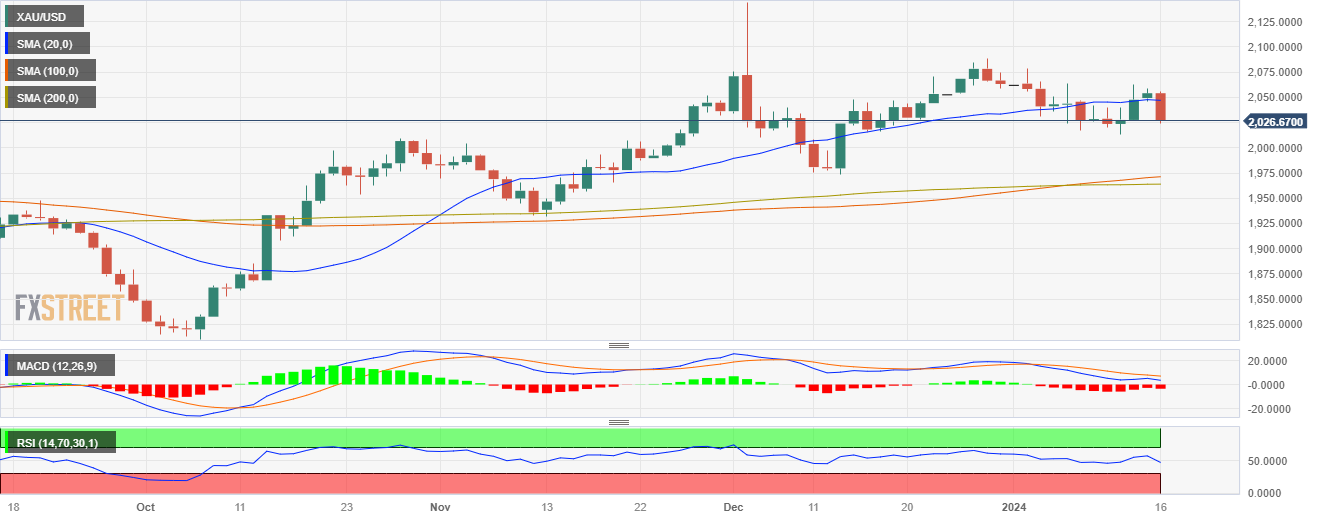
The indicators on the daily chart suggest a mixed outlook for the metal. The Relative Strength Index (RSI) shows a downward trajectory and it currently resides in negative territory. This condition usually hints at a strong selling momentum. Simultaneously, the Moving Average Convergence Divergence (MACD) is displaying increasing red bars. This points to a scenario where the selling pressure is progressively strengthening, adding further weight to the bearish bias in the short-term dynamics.
However, zooming out to the broader perspective, the metal remains in a bullish context as it stays above both the 100-day and 200-day Simple Moving Averages (SMAs). This reveals that, while sellers are attempting to seize control in the immediate term, the overarching buying momentum remains robust, maintaining a buffer against a complete trend reversal.
In summary, while the day-to-day fluctuations may appear towards a continued downward path, the bearish sentiment may be seen as temporary noise within a larger bullish trend.
XAU/USD daily chart
