AUD/USD holds steady after mixed US economic data, Wall Street’s positive close
- AUD/USD slightly up at 0.6571, amidst strong US labor data and mixed US housing market signals.
- US Dollar Index gains on US economic strength; Australian job market worries could influence RBA rate moves.
- Markets await US Consumer Sentiment data and Federal Reserve officials' comments for further direction.
The Australian Dollar (AUD) begins Friday’s Asian session with minuscule gains of 0.02% against the US Dollar (USD), as the economy in the United States (US) remains resilient after the release of strong jobs reports and mixed housing data. At the time of writing, the AUD/USD exchanges hands at 0.6571.
AUD/USD balances between strong US jobs and mixed housing data
Wall Street finished the session with gains, while US Treasury bond yields advanced. The Greenback, as reported by the US Dollar Index (DXY), a basket of six currencies measured against the US Dollar, rose 0.14%, at 103.47, ending with gains for the fifth consecutive day.
The US Bureau of Labor Statistics (BLS) reported that Initial Jobless Claims for the week ending January 13 increased to 187,000, lower than both the previous week's figures and the anticipated consensus of 207,000. At the same time, housing data was mixed with Building Permits rising 1.9%, reaching 1.495 million in December, up from 1.467 million in November and surpassing forecasts of 1.48 million.
Despite that, Housing Starts saw a decline, falling from 1.525 million in November to 1.46 million in December, a decrease of 4.3%, as reported by the US Commerce Department.
Aside from this, the latest Aussie employment report plunged 65,100, erasing an unexpected surge of November, missing forecasts for a 17,600 increase. The report could deter the Reserve Bank of Australia (RBA) from raising rates, as the central bank showed worries about wage growth.
On Friday, Australia’s economic docket was absent, but traders would get cues from the US University of Michigan Consumer Sentiment and Federal Reserve speakers.
AUD/USD Price Analysis: Technical outlook
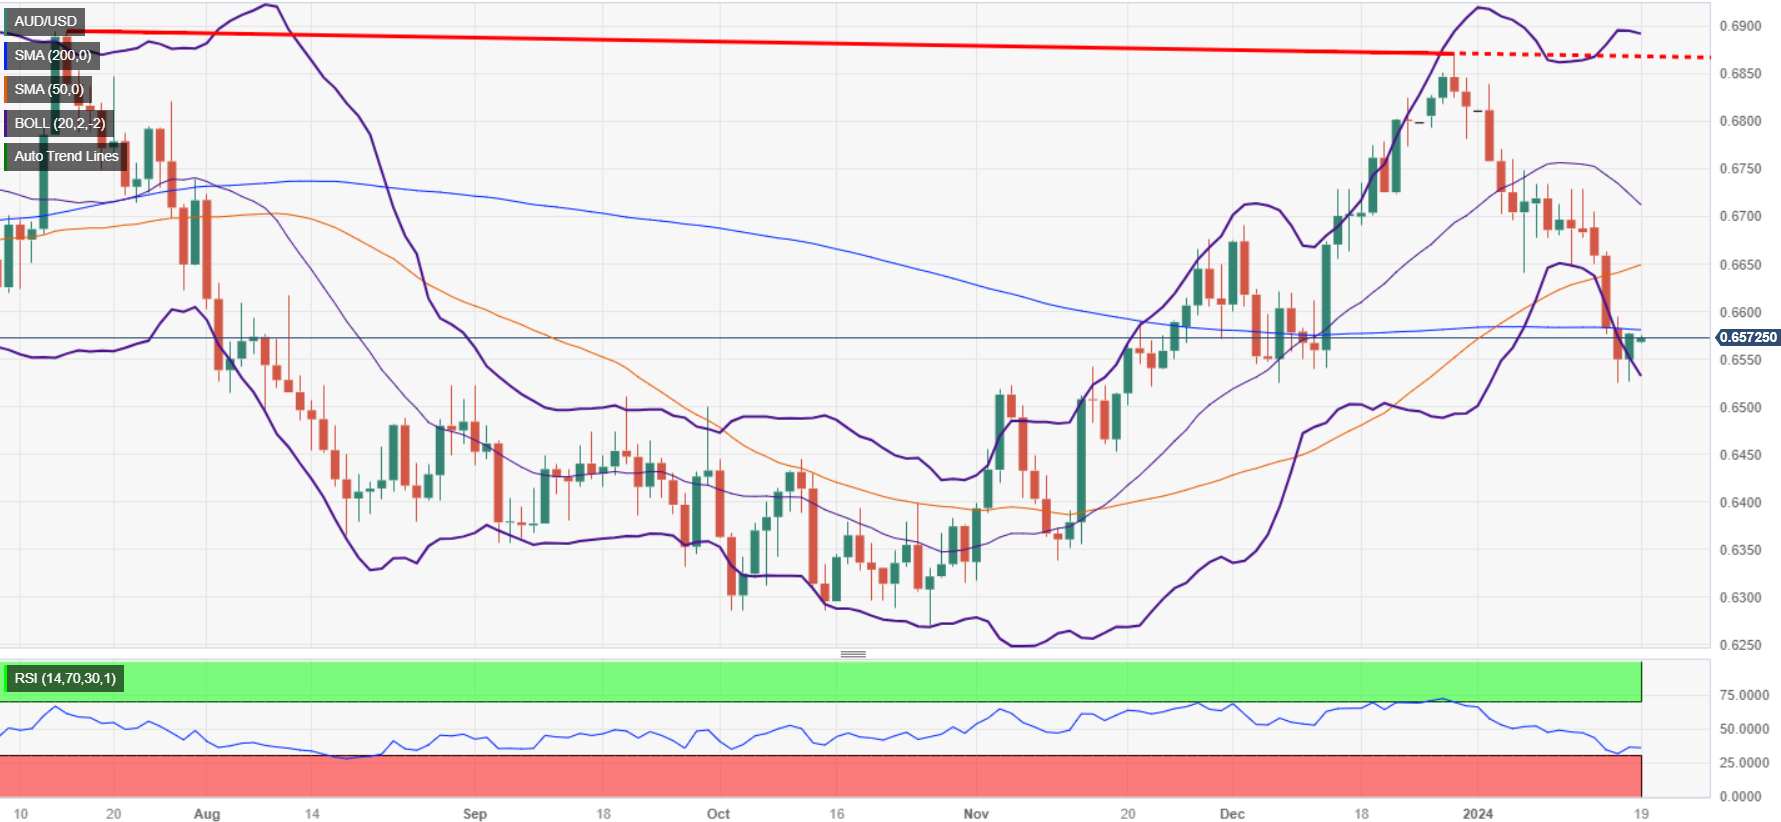
The AUD/USD daily chart portrays the formation of a ‘bullish harami’ candlestick pattern, suggesting that prices might resume to the upside. Nevertheless, buyers will face stir resistance at the 200-day moving average (DMA) at 0.6579, followed by the 0.6600 figure. Conversely, if sellers keep prices from heading above the 200-DMA and push the exchange rate below the 100-DMA at 0.6514, that could pave the way to challenge 0.6500, followed by the next cycle low at 0.6450.
AUD/USD Price Action – Daily Chart
