US equities get dragged higher by upbeat tech sector, NASDAQ 100 hits record high
- US equities broadly rally as markets shrug off mid-week rate tantrum.
- Indexes climbed on tech-led earnings expectations.
- S&P 500, NASDAQ both close near all-time highs.
US equity indexes saw broad gains on Thursday after US stock traders shook off the early week's misery over Federal Reserve (Fed) rate cuts unlikely to come as soon as money markets are hoping. Despite the early week's gains, equity indexes closed near all-time highs on Thursday after the tech sector led major indexes into the top end on earnings hope and general AI hype.
Large-cap tech stocks led the larger market higher on a rosy AI-fueled revenue outlook, with chipmakers seeing the largest gains, particularly tech companies that provide the necessary hardware for AI projects.
According to the CME’s FedWatch tool, markets are now pricing in just a 57% chance of a rate cut from the Fed by the Federal Open Market Committee’s (FOMC) March meeting, with money markets currently pricing in 100% odds of at least some form of Fed easing by May 1. This stands in sharp contrast to the Fed’s current stance, with multiple FOMC governors hitting newswires this week talking down odds of any moves on rates until inflation continues down to 2% appreciably, with notable Fed members including Atlanta Fed President Raphael Bostic noting on Thursday that he doesn’t see Fed reference rates coming down until August at the earliest, barring any significant changes in the US’ current economic outlook.
The S&P 500 (S&P) closed within touch distance of all-time highs of $4,812.38, ending Thursday at $4,780.94 to gain 41.73 points on the day, climbing 0.88%. The Dow Jones Industrial Average (DJIA) climbed over half a percent to gain 201.94 points on Thursday, closing at $37,468.61 while the NASDAQ Composite equity index soared 1.35% to climb over 200 points, ending the day at $15,055.65.
NASDAQ 100 Technical Outlook
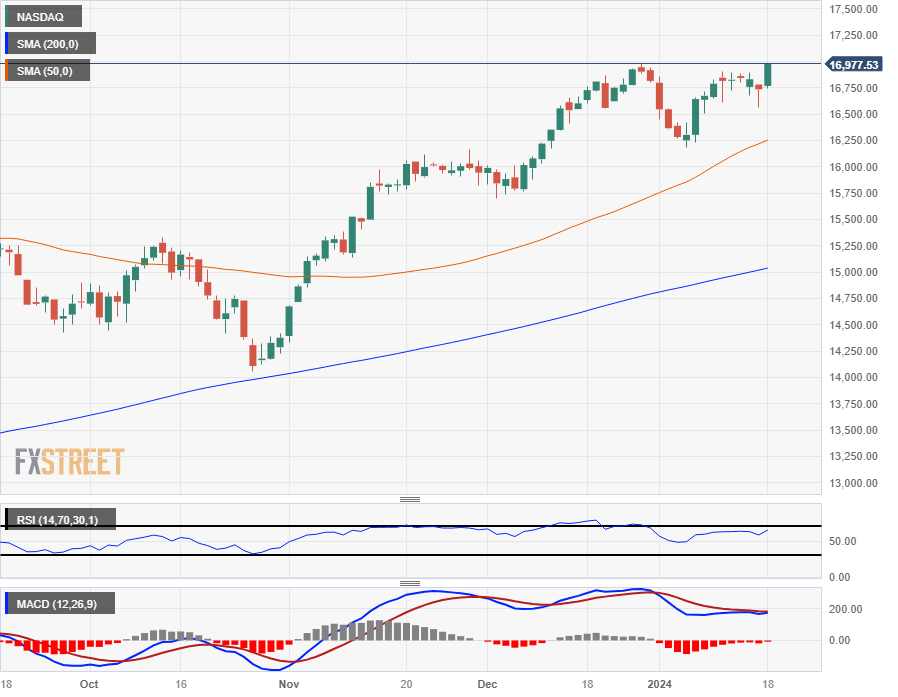
The NASDAQ 100 mega-cap stock index soared to a record high on Thursday, climbing to an all-time high of $16,994.56 and wrapping up Thursday’s market action at $16,982.29, gaining 246.01 points or 1.47%.
Technical levels remain well below current price action, with the 50-day and 200-day Simple Moving Averages (SMA) at $16,254.00 and $15,038.00 respectively. The index has climbed nearly 21% from October’s decline into $14,057.00, and the NASDAQ 100 is on pace to close in the green for all but one of the last 12 consecutive trading weeks.
NASDAQ 100 Daily Chart