AUD/USD dips on strong US data, market focus on US GDP, PCE reports
- AUD/USD shows slight losses, impacted by robust US economic data and central bank actions.
- Positive US S&P Global PMIs fail to bolster the USD, especially the Manufacturing index's leap out of contraction.
- The week ahead lacks would feature US Q4 GDP, PCE index, Durable Goods Orders, and Jobless Claims.
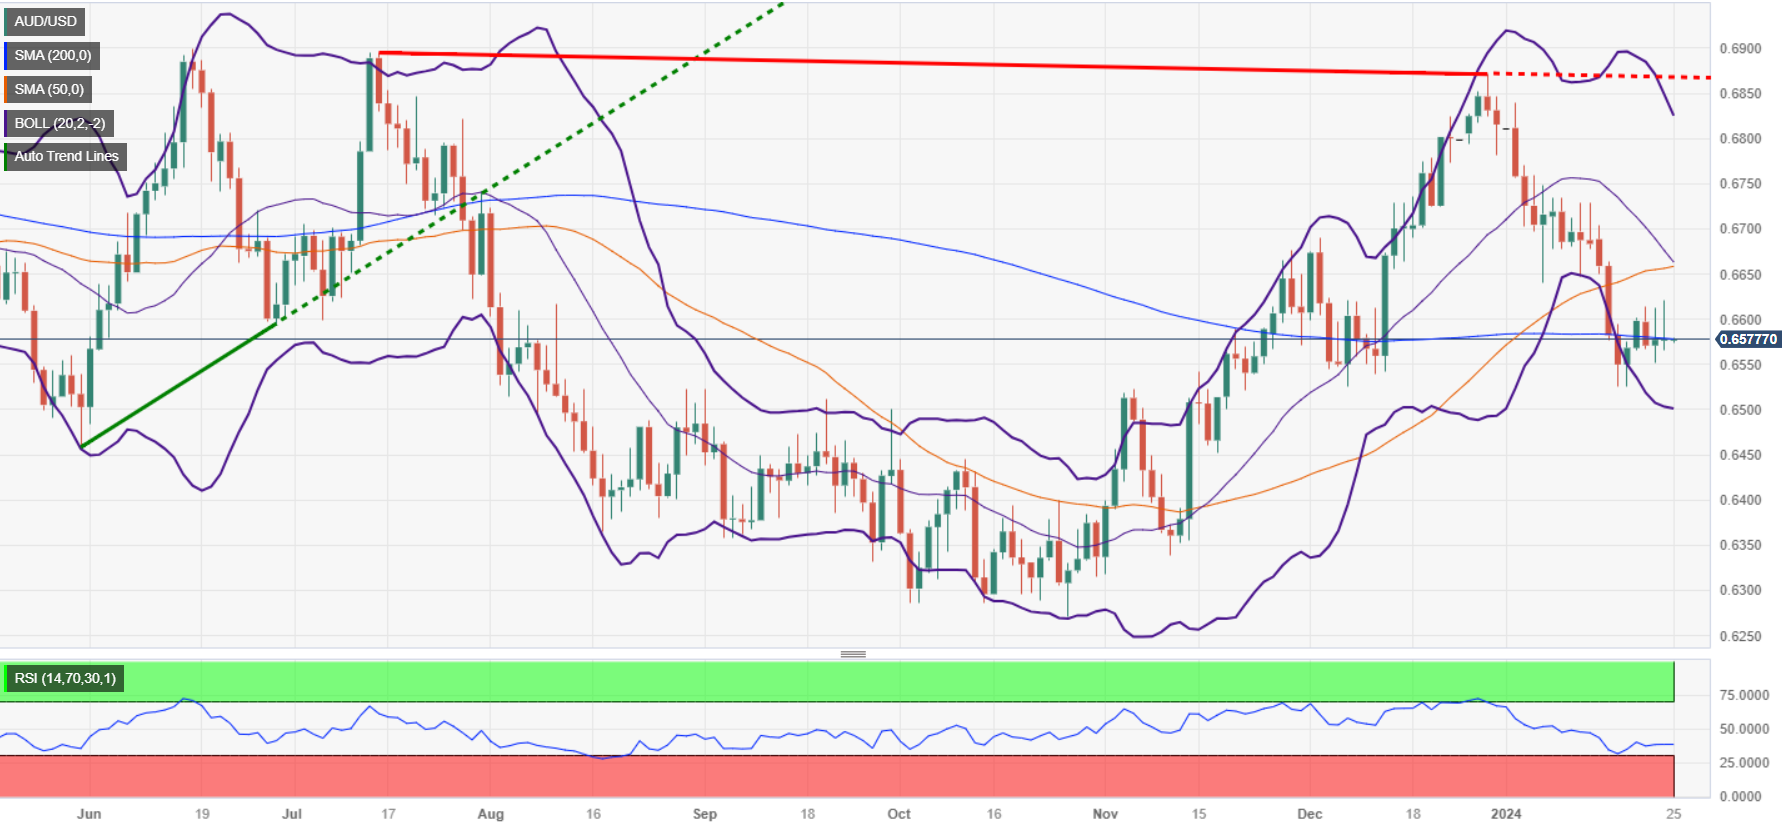
The Australian Dollar (AUD) registers minuscule losses against the US Dollar (USD) as Thursday’s Asian session begins; on Wednesday, the pair ended the session virtually unchanged, closing below the 0.6600 figure on upbeat US economic data. The AUD/USD trades at 0.6576, testing the 200-day moving average (DMA).
AUD/USD virtually unchanged, awaiting US data
In the North American session, US data painted an optimistic economic outlook after S&P Global PMIs expanded sharply, with the three components standing at expansionary territory. The Composite PMI hit 52.1, up 1.4 pts from December, while Services rose to 52.9 from 51.4. But the spotlight was stolen by Manufacturing PMI, which exited from recessionary territory, hitting 50.3 for the first time in the last four months.
Although it was a positive report, the Greenback (USD) weakened by 0.28% to 103.28, according to the US Dollar Index (DXY). Meanwhile, US Treasury yields recovered towards the end of the session, with the 10-year benchmark note gaining 4.8 basis points, up at 4.18%.
Yesterday, Australia’s economic docket featured the Judo Bank PMIs, which improved more than expected, sponsoring a leg-up in the AUD/USD. Besides that, the People’s Bank of China (PBoC) to cut the reserve requirement ratio (RR) for all banks 50 basis points from February 5, lifted the AUD/USD towards a 0.6621 high before tumbling below the 0.6600 mark.
Ahead on the week, the Aussie’s economic docket is absent. Contrarily, the US economic calendar is busy, featuring 2023 Q4 Gross Domestic Product (GDP) figures, the release of the Personal Consumption Expenditures (PCE) price index, Durable Goods Orders, and Initial Jobless Claims.
AUD/USD Daily Chart

AUD/USD Key Technical Levels