GBP/JPY flattens on Thursday with Tokyo CPI inflation ahead
- The GBP/JPY trimmed into median bids with Japanese inflation preview on Friday.
- UK sees GfK Consumer Confidence to end the trading week.
- Guppy entrenched in rangebound pattern.
The GBP/JPY strung along the midrange on Thursday, trading on the low side of the 188.00 handle as markets gear up for Japan’s Tokyo Consumer Price Index (CPI) inflation print early Friday.
It was a light week on the economic calendar for the Pound Sterling (GBP), but Wednesday’s UK Purchasing Managers’ Index (PMI) figures broadly came in above expectations, helping to keep the GBP bid heading into the back half of the trading week.
Japan’s Tokyo CPI inflation print on Friday is expected to moderate for January, with the Core Tokyo CPI forecast to tick down to 1.9% from 2.1% for the year through January as Japanese inflation continues to slow from last January’s YoY peak of 4.3%.
Headline YoY Tokyo CPI in January last printed at 2.4%, with Core-Core Tokyo CPI (headline inflation less fresh food and energy prices) likewise expected to come down from the previous period’s 3.5%.
On the UK side, GfK Consumer Confidence in January is expected to tick up slightly to -21 from December’s -22.
Next week sees mostly mid-tier data for both the UK and Japan, but traders will be gearing up for the Bank of England’s (BoE) next showing slated for next Thursday.
GBP/JPY Technical Outlook
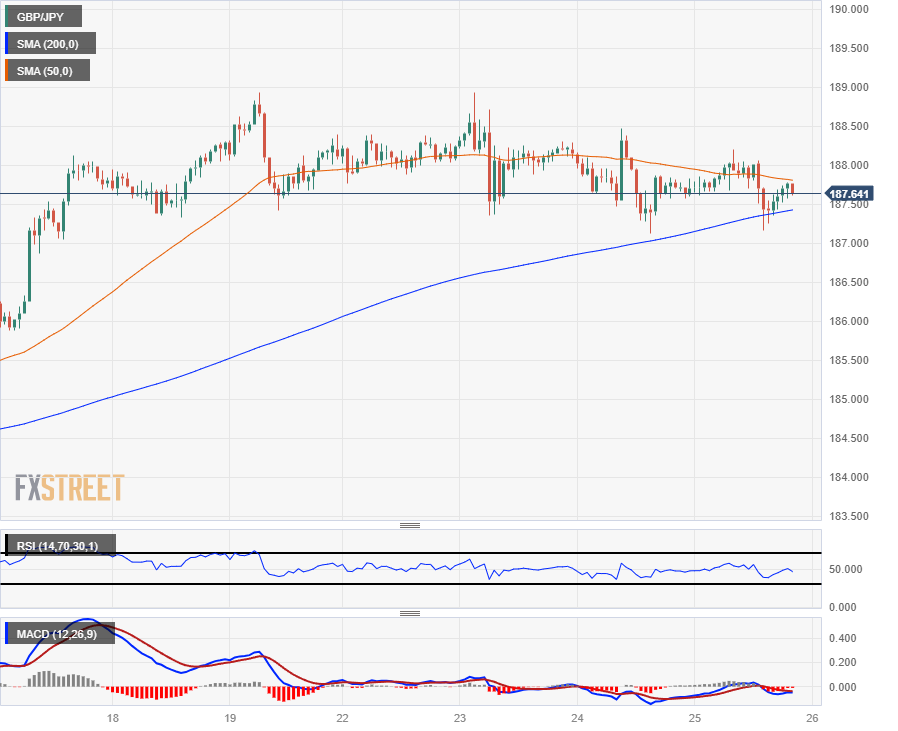
GBP/JPY continues to be plagued by a sideways grind on the intraday charts as bids push into the midrange as the 200-hour Simple Moving Average (SMA) drifts into 187.50, putting a technical floor underneath near-term consolidation.
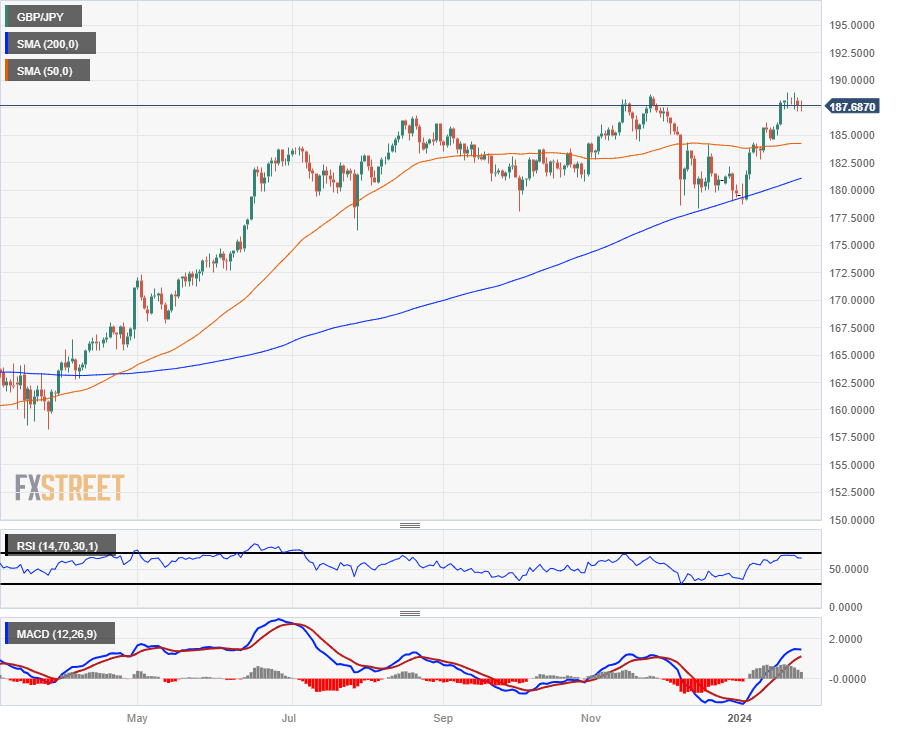
The pair is up over 5% from the last significant pullback into 178.74 at the 200-day SMA in early 2024, but bullish momentum has fully drained out of the pair as middling candles pile up at familiar highs.
GBP/JPY Hourly Chart
GBP/JPY Daily Chart