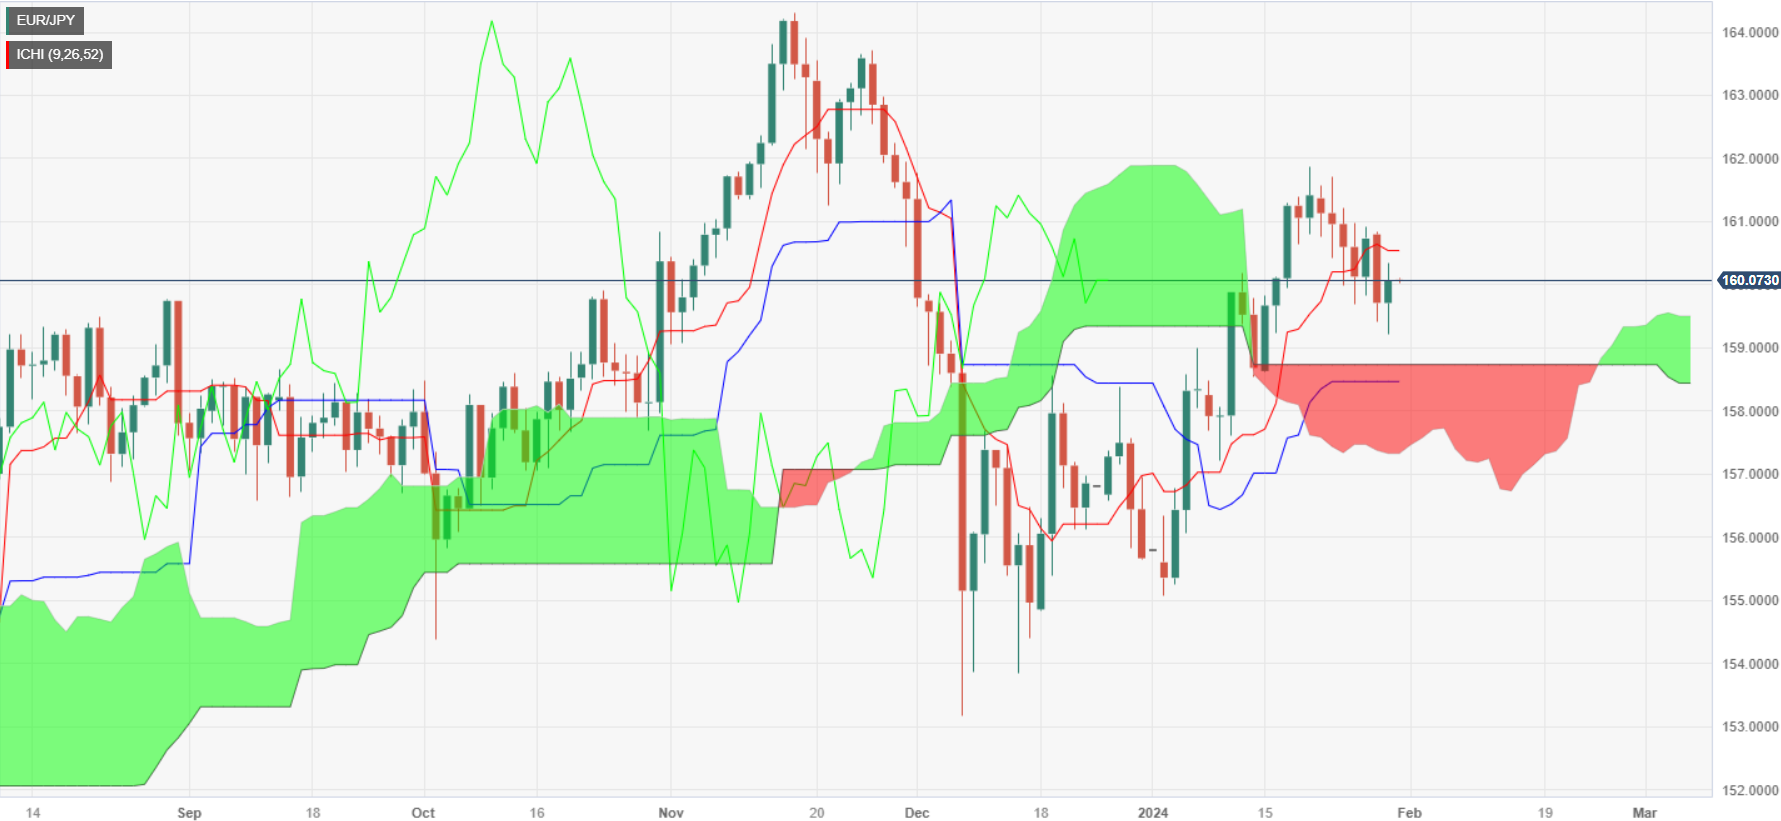
EUR/JPY Price Analysis: Clings to 160.00 as ‘hammer’ surfaces after EU’s data
- EUR/JPY edges up after robust Euro area GDP figures and subdued Japanese inflation impact market sentiment.
- Technical analysis suggests a potential move towards the Tenkan-Sen at 160.54, with 161.00 and January 19 high at 161.87 as key resistance levels.
- Downward pressure remains a risk, with crucial support near the 159.50 - 159.70 range and further potential decline towards 159.00 and 158.47.
The EUR/JPY advances modestly on Tuesday, and buyers recover the psychological 160.00 figure. Solid GDP data from the Euro area, along with lower-than-expected inflation data in Japan, eases the pressure off the Bank of Japan (BoJ) to end its ultra-loose policy. At the time of writing, the pair exchanges hands at 160.08, after hitting a daily low of 159.21.
The pair is neutral biased as the daily chat portrays. But, the recent fundamental news, along with an improvement in risk appetite, could pave the way to test resistance at the Tenkan-Sen at 160.54. A decisive break could sponsor a leg-up to the 161.00 mark before buyers step in and lift the exchange rate toward January’s 19 high at 161.87. Further upside is seen at 162.00.
Conversely, if EUR/JPY sellers’ step in and prevent a daily close above 160.00, that would exacerbate a leg-down. The first support would be a seven-month-old support trendline at around 159.50 – 159.70, also a confluence with the Senkou Span A at 159.50. Once that area is cleared, expect a drop to 159.00, before diving to the Senkou Span B at 158.47.
EUR/JPY Price Action – Daily Chart

EUR/JPY Technical Levels