AUD/JPY Price Analysis: Slips below the 100-day SMA, outlook turns negative
- The AUD/JPY is experiencing a downward shift at 96.18, seeing a 0.23% loss.
- Indicators on the daily chart show a negative outlook as the cross now trades below the 20 and 100-day SMA.
- Four-hour chart indicators are consolidating after hitting oversold conditions.
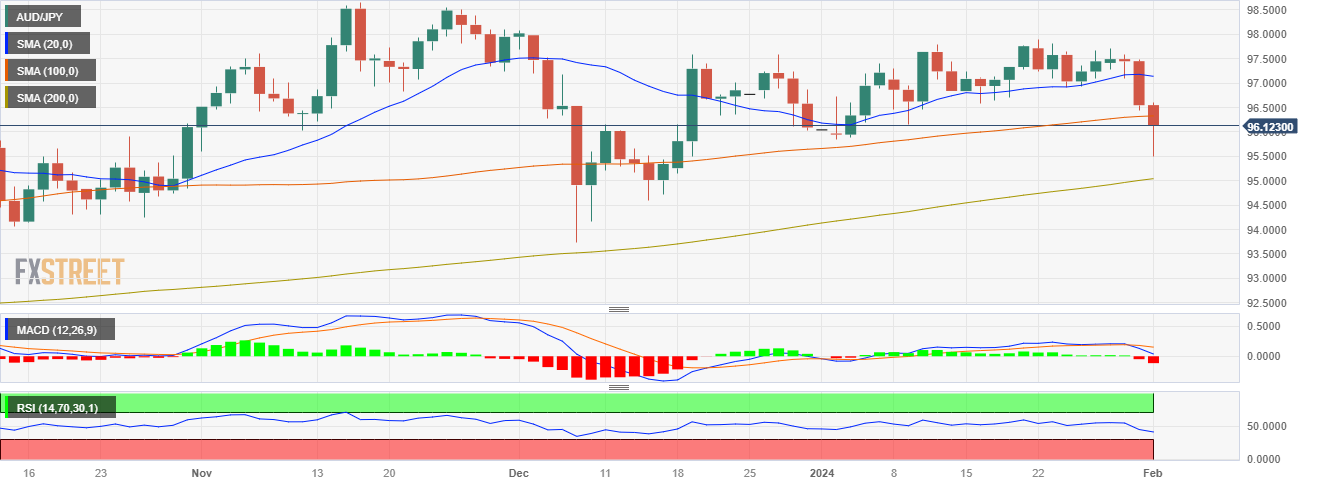
On Thursday's session, the AUD/JPY experienced a downturn, hovering at 96.18 after hitting a its lowest level since mid December near 95.50. The daily chart conveys a bearish hue with the sellers gaining substantial ground. Meanwhile, the four-hour chart indicators seem to have enter in a consolidation phase, following a dip into oversold territories.
In the daily chart perspective, the leading indicators signal an inclined selling momentum. The Relative Strength Index (RSI) is charting a downward trajectory indicating bearish strength, especially within a negative zone. This is echoed by the Moving Average Convergence Divergence (MACD) which prints a surge in red bars, indicating increasing bearish pressure. Furthermore, the cross fell below the 100-day Simple Moving Average (SMA), a strong resistance which strengthens the case for the sellers .
Inspecting the shorter-term dynamics from the four-hour chart, it appears the bearish tendency seems to be leveling off. Indicators have moved to a stable phase after previously registering oversold conditions. The RSI in particular, maintains a flat formation in a negative territory, indicating a momentary pause in downward momentum. Additionally, the MACD also show flat red bars indicating growth in short-term selling pressure, though at a decreasing rate.
AUD/JPY daily chart

AUD/JPY levels to watch