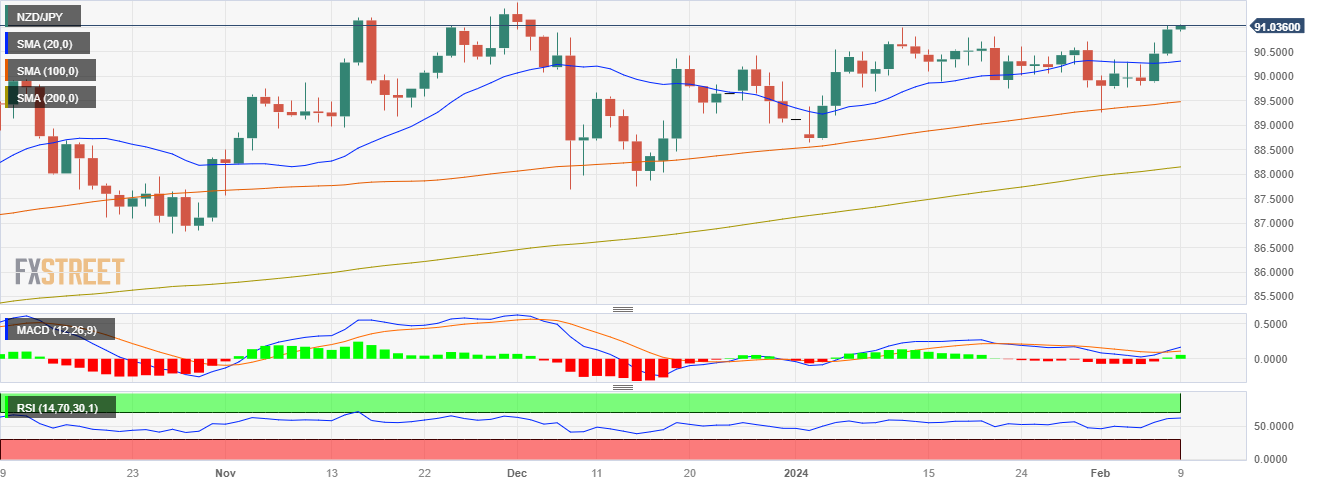
NZD/JPY rallies to multi-month highs due to dovish BoJ
- The NZD/JPY rose to 91.05 on Thursday, registering a 0.70% rally.
- The Yen was one of the worst-performing currencies due to dovish BoJ comments.
- On the four-hour chart, overbought conditions suggest a possible correction in the near term.
In Thursday's session, the NZD/JPY staged a rally to land at 91.05, buoyed by steady a softening Yen due to the Bank of Japan’s (BoJ) dovish stance. With the daily chart painting a bullish picture, the pair is tipped in favor of the Kiwi as the pair stands at its highest level since November. However, a potential correction looms on the horizon as the four-hour chart indicators strayed into overbought territory.
In line with that, Deputy Governor Uchida highlighted the unlikelihood of sudden rate hikes which drove markets to bet on a more dovish approach of the BoJ regarding its pivot to a more hawkish policy. For the next sessions, incoming data will be key to dictate the pace of the cross but in case Japan reports negative data, the cross could see further upside as the BoJ won't have incentives to leave its ultra-loose policy.
NZD/JPY technical analysis
The technical indicators on the daily chart reflect bullish dominance. Despite a consolidation looming in the immediate term, the cross is trending above its 20, 100, and 200-day Simple Moving Averages (SMAs), indicative of the buyers' stronghold on larger time frames. The rising slope and placement in the upper region of the Relative Strength Index (RSI) also reinforces the continued bullishness. Moreover, the Moving Average Convergence Divergence (MACD) histogram is demonstrating an uptick with the green bars becoming longer, further empowering the buying momentum.
NZD/JPY daily chart

On the shorter four-hour chart, however, a temporary pullback seems likely. The technical indicators have reached the overbought zone suggesting the possibility of an imminent correction. In this context, the Relative Strength Index (RSI) rose above 70 while the Moving Average Convergence Divergence (MACD) displays rising green bars. Given the intense buying pressure in the shorter time frame, a brief retreat in prices aligns with usual asset behavior after bouts of aggressive purchasing momentum.