WTI tests $78.00 as Crude Oil continues rise, but headwinds are mounting
- WTI chalks in a seventh straight gain on Tuesday as geopolitical headlines remain.
- A bumper US CPI inflation print keeps barrel prices capped.
- US API Weekly Crude Stocks surged once again.
West Texas Intermediate (WTI) US Crude Oil climbed for a seventh consecutive day on Tuesday, testing the $78.00 per barrel price handle before settling near $77.40. Geopolitical tensions continue to keep Crude Oil bolstered, but an overhang in US crude supplies is weighing down energy markets, alongside a hotter-than-expected US Consumer Price Index (CPI) inflation print restraining investor sentiment.
US CPI inflation declines to 3.1% in January vs. 2.9% forecast
US CPI inflation came in higher and hotter than markets were hoping for, driving down money market expectations of a Federal Reserve (Fed) rate cut. The CME’s FedWatch Tool shows rate markets are now pricing in a first Fed rate trim in June, helping to keep oi barrel bids under pressure.
Geopolitics continue to be the main driver of Crude Oil upside momentum as a ceasefire in the Gaza conflict appears to be elusive, and the Russia-Ukraine conflict continues to slow burn on Eastern European markets as sanctions weigh on Russian Crude Oil markets.
The US’ American Petroleum Institute’s (API) weekly barrel counts showed a surprise buildup of 8.52 million barrels in the US Crude Oil supply stream, a much higher buildup than the forecast 2.6 million barrels. It is the largest buildup of US Crude Oil since the API’s mid-November barrel counts print.
WTI technical outlook
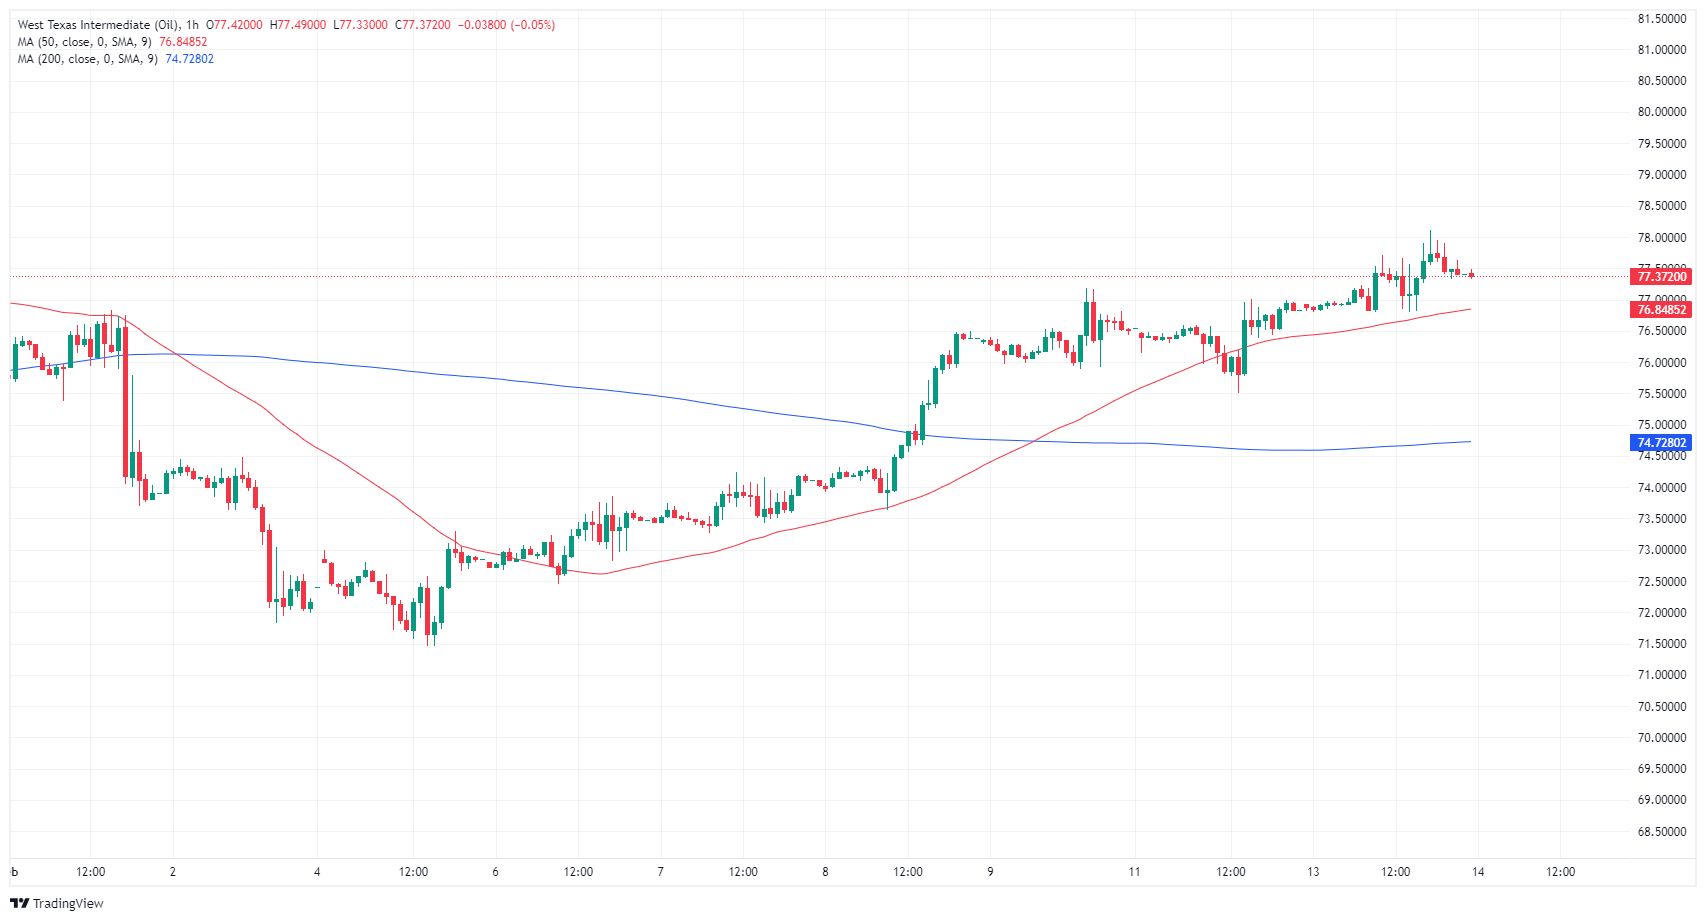
Near-term momentum in WTI US Crude Oil remains firmly bullish, with intraday action trading well above the 200-hour Simple Moving Average (SMA) near $74.72. WTI has traded north of the 200-hour SMA since crossing over the median technical barrier last week, and the near-term technical ceiling sits at Tuesday’s failed breach of the $78.00 handle.
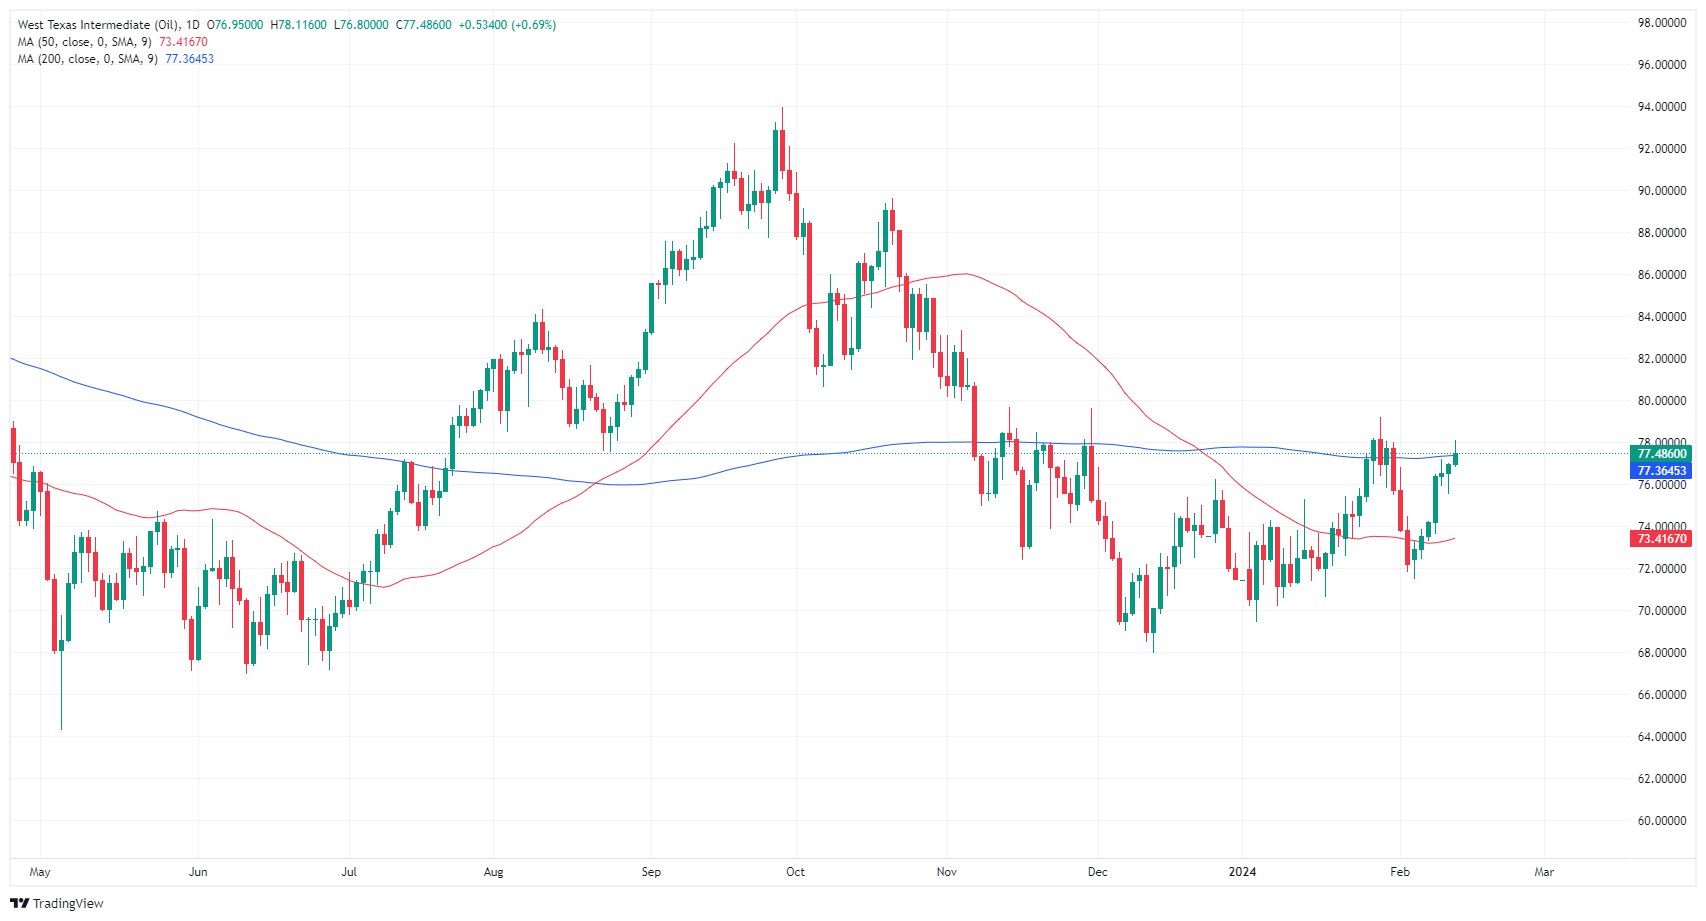
Tuesday’s bullish push left WTI overextended into the 200-day SMA priced in near $77.36, and a failed bullish climb over the key technical indicator will leave WTI bids exposed to an extended backslide into early February’s bottom bids near $72.00.
WTI hourly chart
WTI daily chart