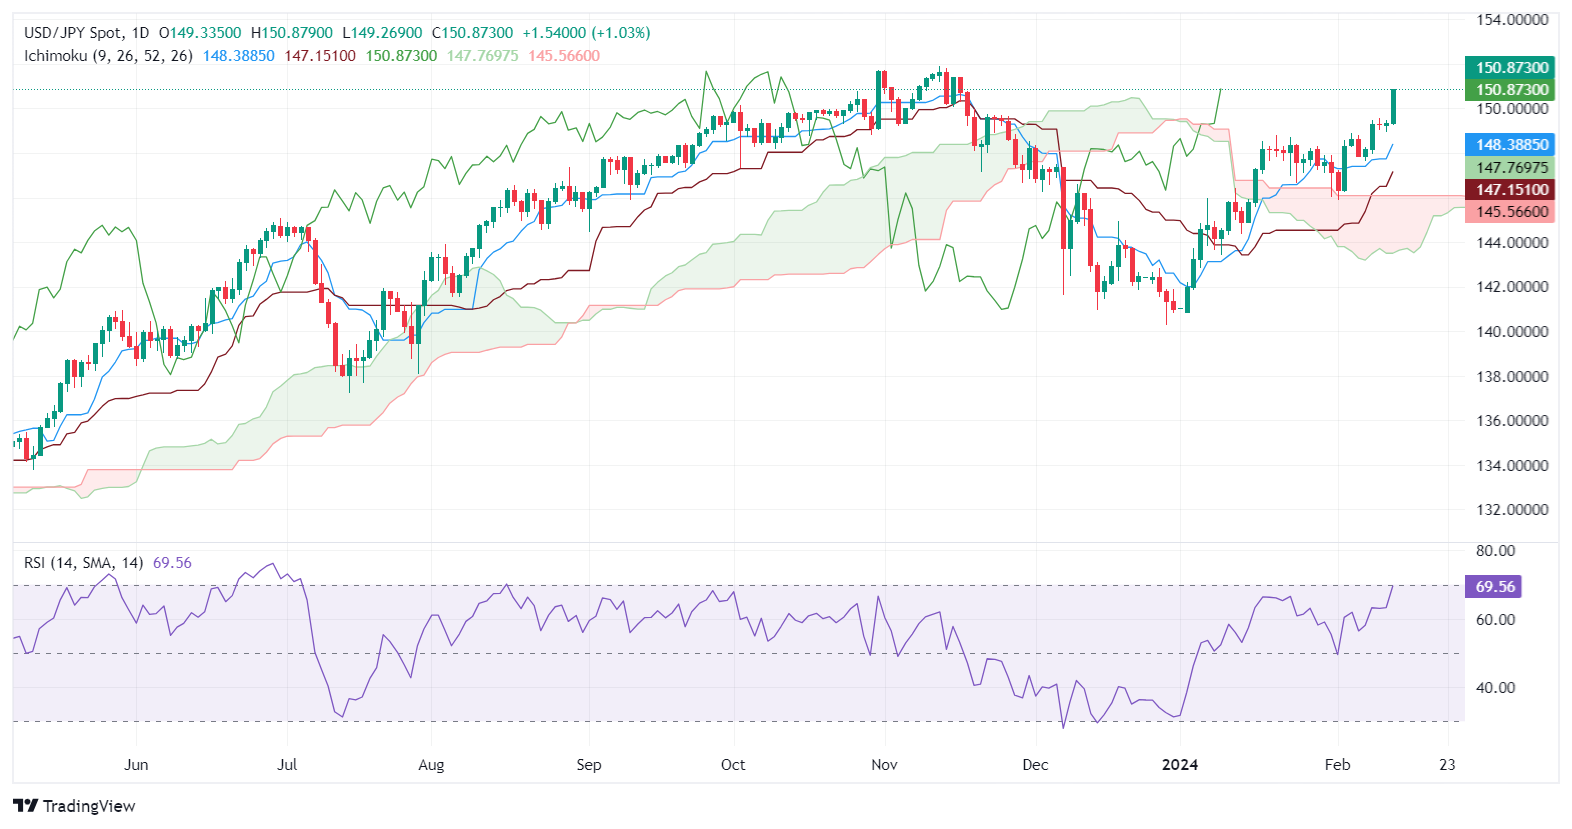
USD/JPY hits three-month peak as US inflation data surprises
- USD/JPY hits three-month high fueled by US CPI data revealing slower but higher inflation than expected.
- January CPI at 3.1% vs. 2.9% forecast and Core CPI at 3.9%, dampening hopes for near-term Fed rate cuts.
- Surge past 150.00 level supported by rising US Treasury yields, altering investor expectations for Fed easing.
The USD/JPY surged to a three-month high of 150.81 after the US Bureau of Labor Statistics (BLS) revealed that inflation in the United States (US) remains above the 3% threshold, although slowing down. At the time of writing, the pair exchanges hands at 150.78, up 0.96%.
Persistent US inflation report lifts US Treasury yields, tailwind for USD/JPY
Wall Street is trading with losses following the latest inflation data. The Consumer Price Index (CPI) in January exceeded estimates of 2.9% YoY, increased by 3.1% below last month’s 3.4% reading. Excluding volatile items, known as Core CPI, was unchanged compared to December’s reading at 3.9%, up from estimates of 3.7% YoY.
After the data, the USD/JPY shot through the roof, extending its gains past the 150.00 figure, hitting a three-month high, sponsored by the jump in US Treasury yields. The 10-year benchmark note yields 4.314%, up by more than 13 basis points, as investors trimmed the odds for a Federal Reserve rate cut.
The CME FedWatch Tool shows traders disregarding a cut in March and May, though the odds for June increased. Therefore, the federal funds rate (FFR) would remain at 5.25%-5.50% according to the swaps market for the first five months of 2024.
Meanwhile, the Bank of Japan (BoJ) has shown mixed signs regarding the future of its monetary policy stance. Data-wise, Machinery Orders plunged -14.1% YoY, the weakest level since October, while the Producer Price Index (PPI) was steady at 0.2% YoY. Although market players are still seeing the BoJ increase rate in June, they could delay the end of negative interest rates unless data suggests inflation would be sustainably above their 2% target.
USD/JPY Price Analysis: Technical outlook
The daily chart portrays the pair's upward bias, with 151.00 as the next resistance level. Once that level is cleared, the USD/JPY next stop would be last year’s 151.91 high, followed by the 152.00 mark. Conversely, if sellers regain the 150.00 level, that could open the door for further losses. In that case, key support levels would be tested. Firstly, the Tenkan-Sen at 148.38, followed by the Senkou Span A at 147.77. Once those two levels are cleared, the next stop would be the Kijun-Sen at 147.15.
