AUD/USD gains some ground on weak US data, outlook still negative
- The AUD/USD is trading at 0.6520, gaining 0.40, in Thursday's session.
- Weak Retail Sales data from January from the US weakened the USD.
- If markets continue to delay rate cuts on the Fed, the upside is limited.
On Thursday, the AUD/USD pair traded near 0.6520, marking a gain of 0.40% mainly driven by the report of weak economic data from the United States (US). However, as long as the markets bet on the Federal Reserve (Fed) delaying cuts, the pair may see further downside.
The economic health of the United States remains robust, underpinned by rejuvenated labor markets, accelerating Gross Domestic Product (GDP) growth, and sticky inflation levels. As a reaction, the US Dollar performed strongly against its rivals at the beginning of 2024, as markets started to delay the Fed’s rate cuts to June giving up hopes on a cut in the March and May meetings.
Conversely, the Australian economy has exhibited a modest performance due to persistent pressures in the labor market and tepid inflation growth. The expectation is for the Reserve Bank of Australia (RBA) to hold rates steady until August which may give the Aussie some advantage over the USD but if its economy continues weakening, the upside will be limited.
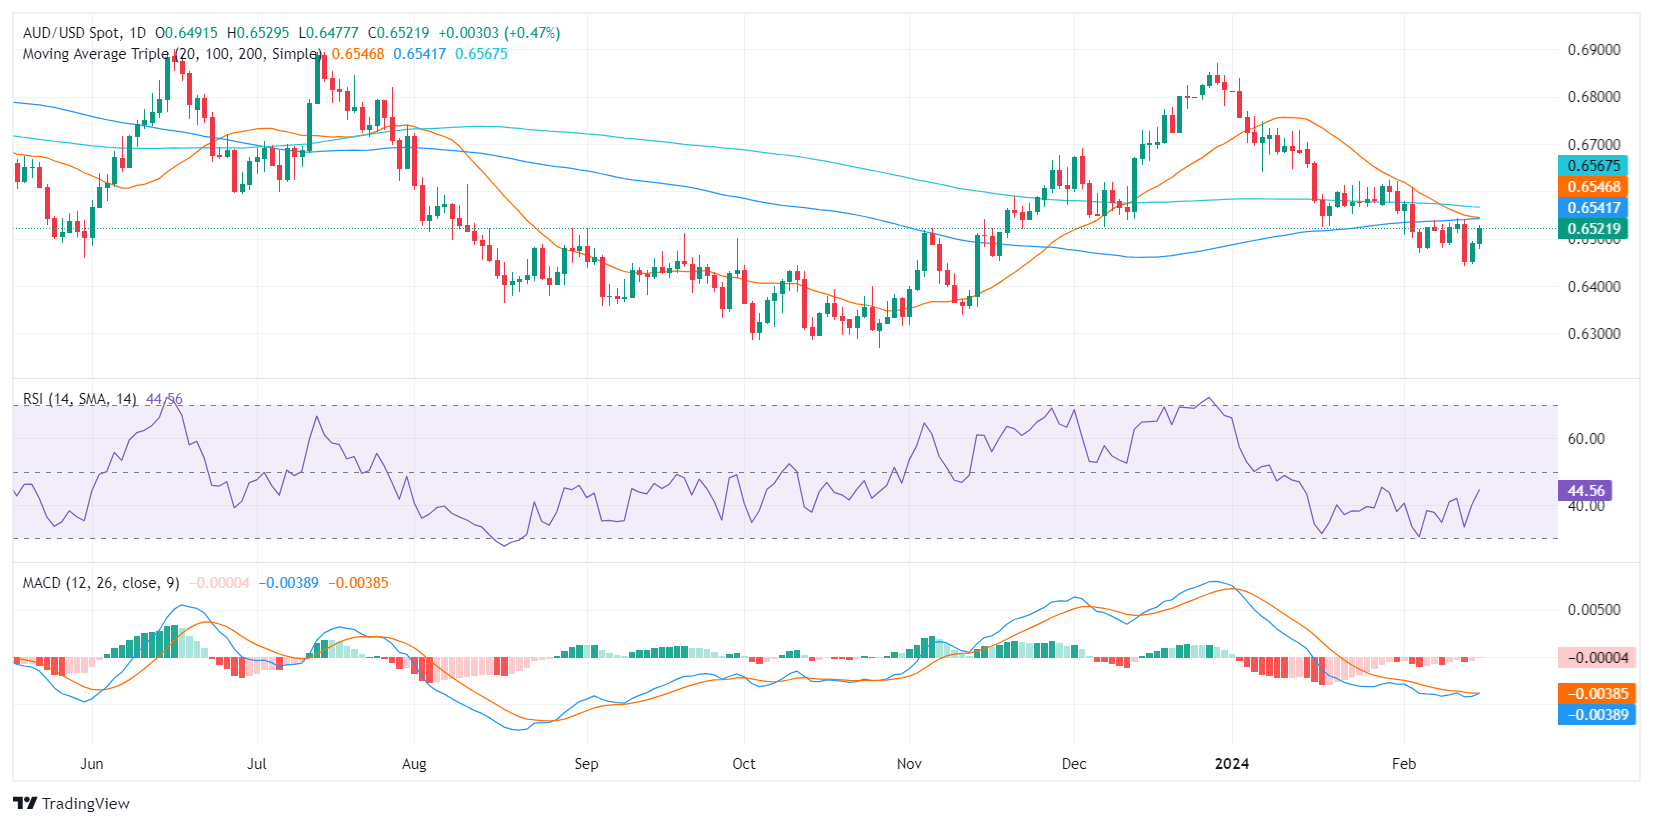
AUD/USD technical analysis
Based on the daily RSI (Relative Strength Index) values, the index is within the negative territory over the past 10 days. This suggests that selling pressure has been dominant in the market. Looking at the MACD (Moving Average Convergence Divergence) histogram on the daily chart, the color of the bars indicates negative momentum with red bars, reinforcing the steady bearish sentiment.
Overall, in the larger context, the AUDUSD pair remains below its main Simple Moving Averages (SMAs) 20, 100, and 200-day SMAs, suggesting a bearish trend in the broader picture. So unless the buyers make a move above the 20-day average, the outlook will still be negative.
