NZD/JPY Price Analysis: Bearish short-term signals surface, as buyers take profits
- The NZD/JPY currently trades at 93.031, down 0.21% in Monday's session.
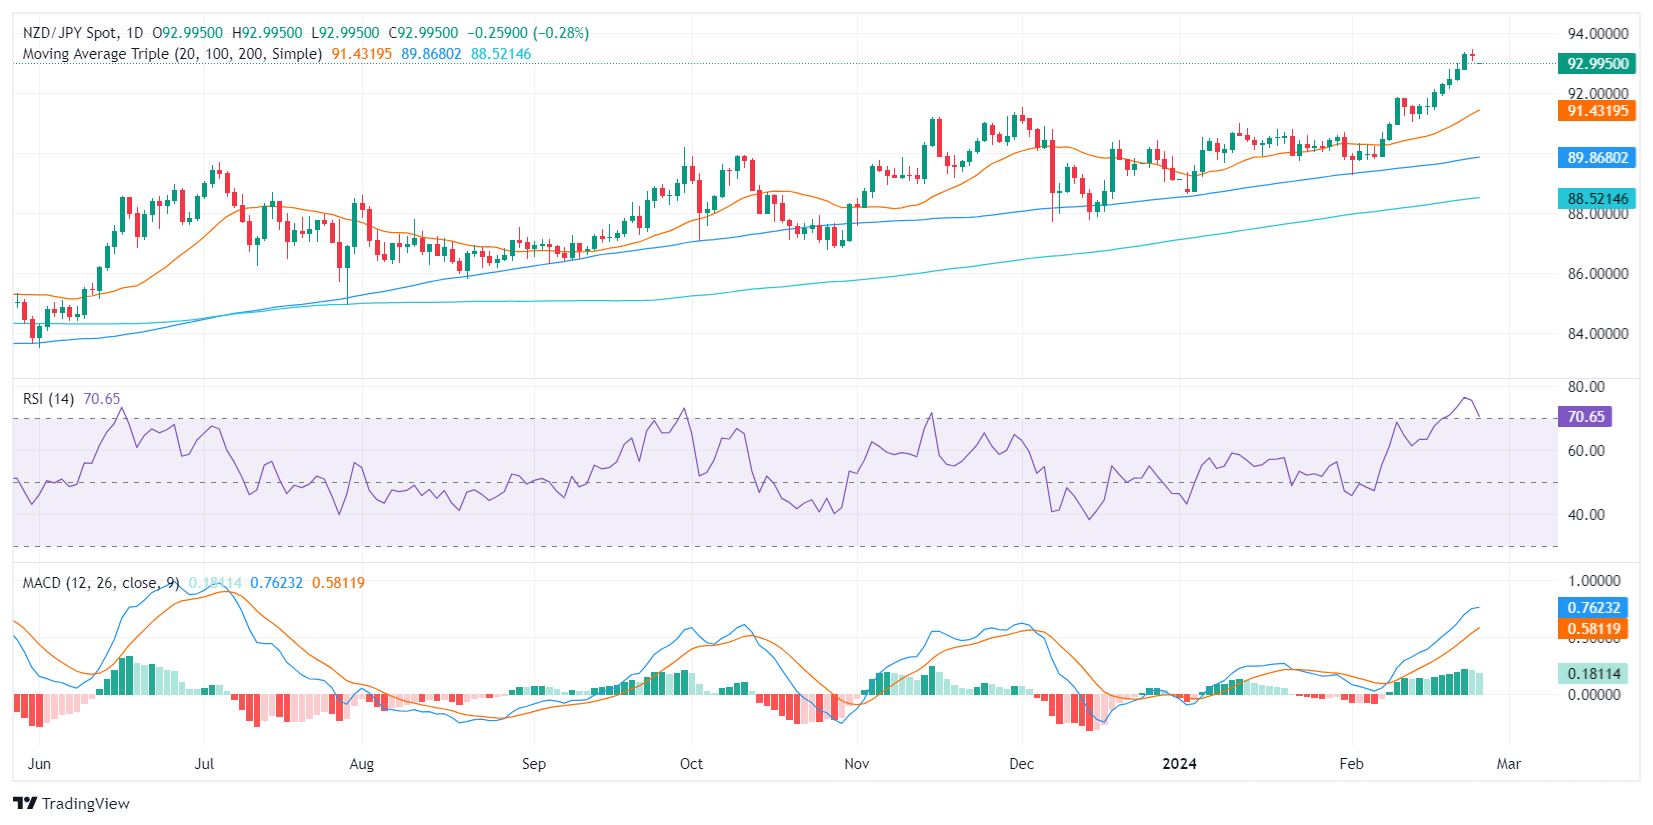
- The daily RSI remains in the overbought area, suggesting that further consolidating may be incoming.
- Despite the short-term bearish signals, the pair is operating above the main SMAs, indicating an overall bullish trend.
In Monday's session, the NZD/JPY pair is trading at 93.03, experiencing a decline of 0.21% as indicators seem to be correcting overbought conditions that propelled the pair to highs since 2015.
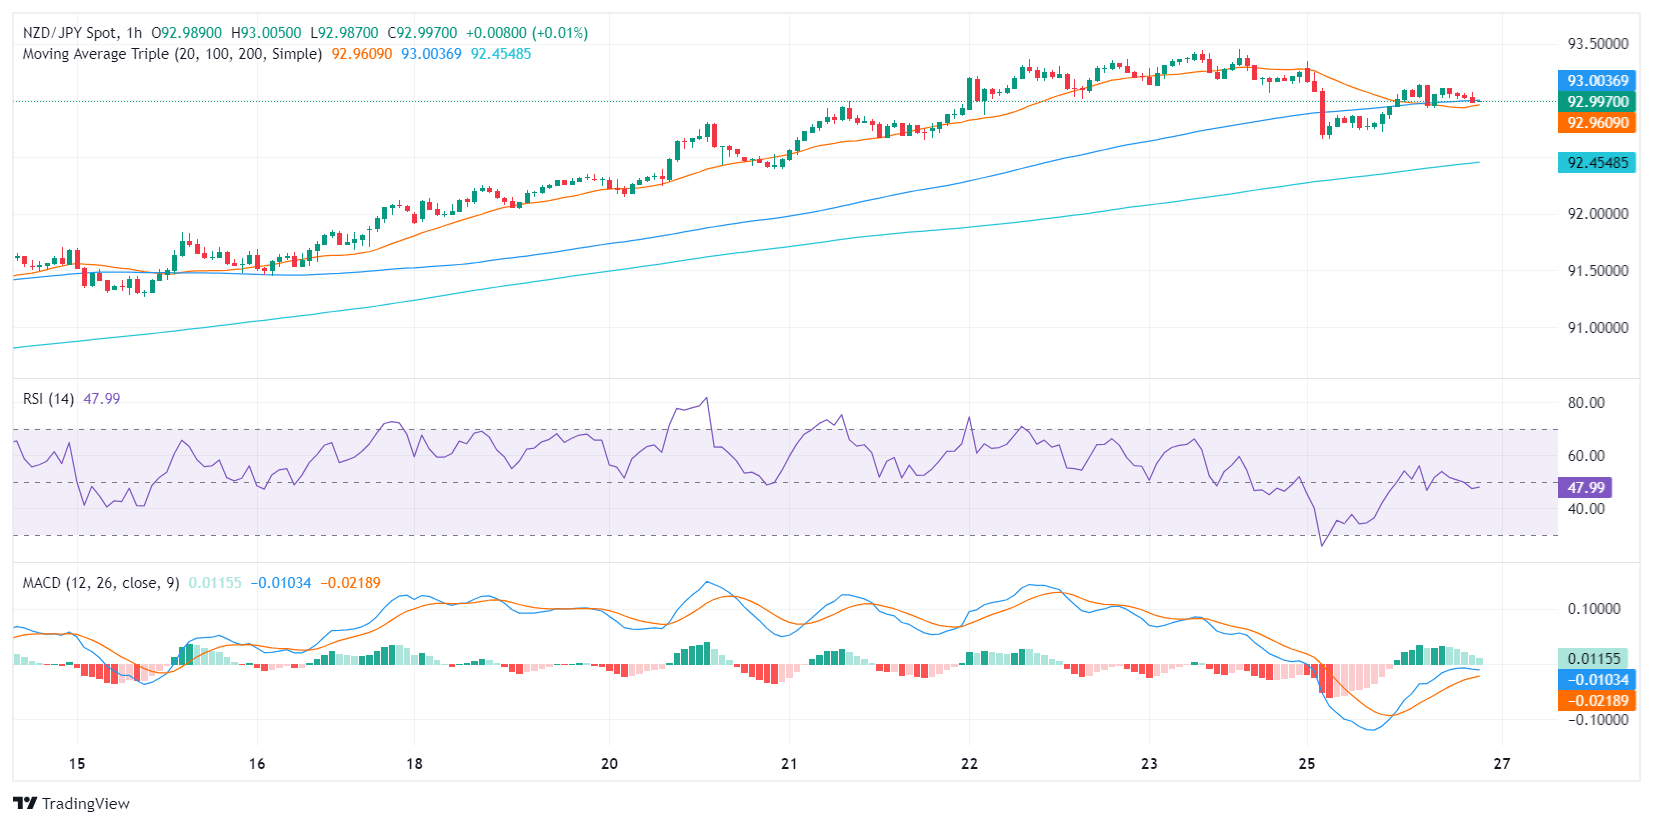
The daily Relative Strength Index (RSI) for the NZD/JPY pair is showing a downward trajectory, still correcting overbought conditions, lying around 70. This suggests a loss of upward momentum, signaling that sellers might be gaining an upper hand. Additionally, falling green bars of the Moving Average Convergence Divergence (MACD) histogram on the daily and hourly chart indicates a decrease in positive momentum, further strengthening the case for bearish sentiment in the short term.
On the other hand, the pair is trading above the 20, 100, and 200-day Simple Moving Averages (SMAs), indicative of an overall bullish long-term trend. This divergence between short-term and long-term indicators suggests that buyers took a step back to consolidate profits after last week’s 2% rally. In that sense, as long as the cross holds above these key levels, all downward movements won’t affect the bullish bias of the pair and could be considered a consolidation.
NZD/JPY daily chart

NZD/JPY hourly chart