AUD/USD edges higher as traders eye Aussie’s CPI, US GDP
- AUD/USD makes modest recovery, up 0.05%, as markets eye upcoming Australian CPI and US GDP data releases.
- US Durable Goods Orders contract more than expected; Home Prices surge, fueling mixed sentiment on Wall Street.
- Reserve Bank of New Zealand's policy decision and Federal Reserve officials' remarks to influence AUD/USD direction.
The Australian Dollar pared some of its losses against the US Dollar on Tuesday and finished the session with minimal gains of 0.05%. As the Asian session begins, the AUD/USD trades at 0.6542, at the time of writing, down by 0.02% as investors brace for the release of crucial data.
AUD/USD sees slight gains as investors await key Australian and US economic indicators
Price action in Wall Street was muted as investors prepared for the release of a tranche of US data. On Tuesday, the US economic docket revealed that January’s Durable Goods Orders shrank -6.1% MoM, exceeding estimates and the previous month’s data of -4.5% and -0.3% contraction. Besides, US housing data revealed that Home Prices in December advanced 6.1% YoY, above forecasts, and November’s data.
Moving into Wednesday’s data, the Australian Bureau of Statistics (ABS) will feature inflation figures for January. According to the consensus, the Consumer Price Index (CPI) is expected to have risen 3.6% YoY. A monetary policy decision in New Zealand could underpin the Aussie Dollar (AUD) in the event of a hawkish hold by the Reserve Bank of New Zealand (RBNZ).
On the US front, the US Bureau of Economic Analysis (BEA) will announce the second estimate of the Gross Domestic Product (GDP) for the last quarter of 2023. The consensus expects GDP to stand at 3.3% QoQ. AUD/USD traders would also gather direction from three Federal Reserve officials crossing the newswires.
AUD/USD Price Analysis: Technical outlook
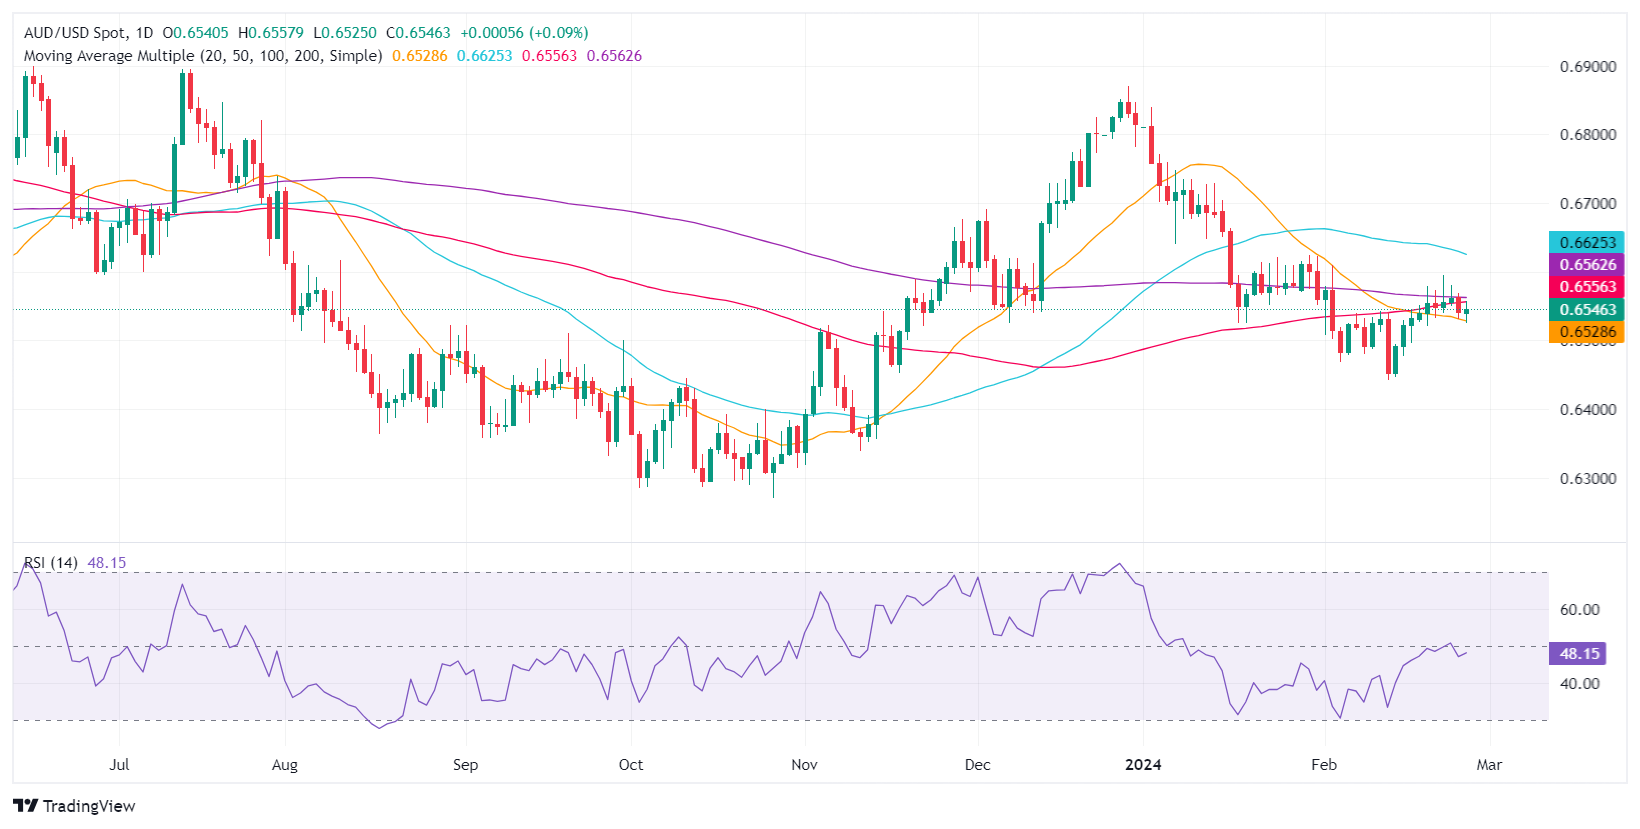
The AUD/USD remains neutral to downward bias, even though the exchange rate hovers around key technical levels, like the 100, 200, and 50-day moving averages (DMAs). Further confirmation is provided by the Relative Strength Index (RSI) punching below the 50-midline turning bearish, while the latest cycle high remains well below the current year-to-date (YTD) high at 0.6624.
For a bearish continuation, the AUD/USD must dive below the February 27 low of 0.6524, and the 0.6500 figure. Once those levels are cleared, look for a test of the YTD low of 0.6442. On the flip side, if buyers push the exchange rate above the 100 and 200-DMAs at around 0.6559, that could pave the way to challenge 0.6600.
