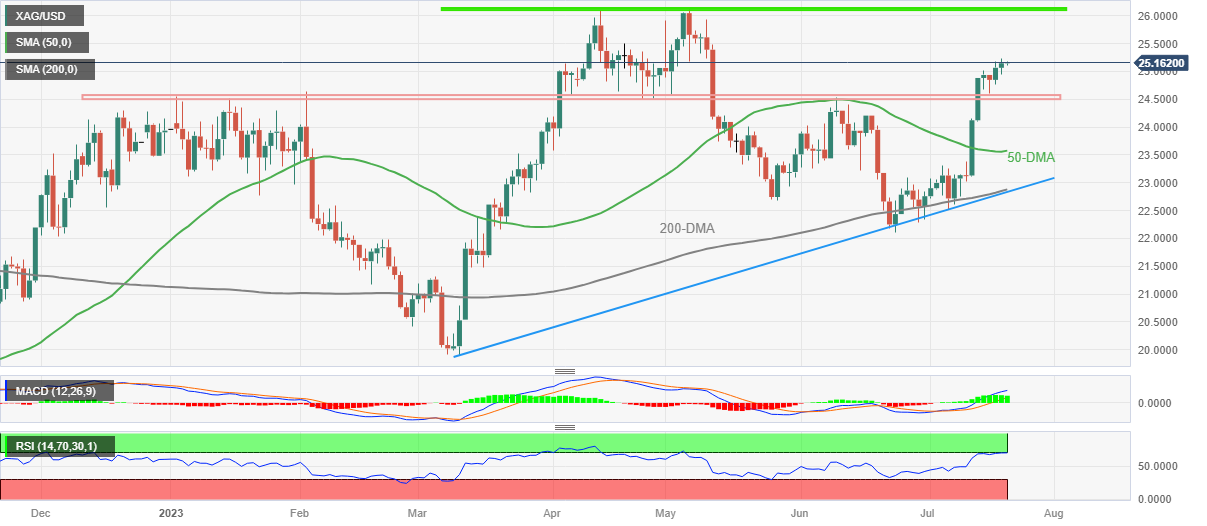
Silver Price Analysis: Overbought RSI prods XAG/USD run-up towards $26.10-15 hurdle
- Silver Price seesaws around 10-week high after two-day winning streak, lacks upside momentum of late.
- Clear break of yearly horizontal resistance, bullish MACD signals favor XAG/USD buyers.
- Overbought RSI conditions challenge upside targeting double tops marked in April, May.
Silver Price (XAG/USD) remains sidelined around $25.15 as bulls take a breather after a two-day uptrend at the 2.5-month high amid Thursday’s sluggish Asian session. In doing so, the XAG/USD justifies overbought RSI but stays on the bull’s radar.
That said, bullish MACD signals joined the previous week’s upside break of a horizontal area comprising multiple tops marked since early January, around $24.50-55, to enable the Silver Price to refresh the multi-day top.
With this, the XAG/USD bulls are likely to occupy the driver’s seat unless witnessing a daily closing below $24.50.
Following that, the metal’s downturn toward the 50-DMA level of around $23.60 appears imminent.
However, a convergence of the 200-DMA and an upward-sloping support line from March 10, close to $22.90, will be crucial for the XAG/USD bears to conquer before retaking control.
On the flip side, the $26.00 round figure remains on the radar of intraday Silver buyers before targeting the “double top” formation level of around $26.10-15.
Should the XAG/USD ignores overbought RSI and crosses the $26.15 hurdle, the odds of witnessing a stellar run-up towards the previous yearly high of around $27.00 can’t be ruled out.
Silver Price: Daily chart

Trend: Limited upside expected