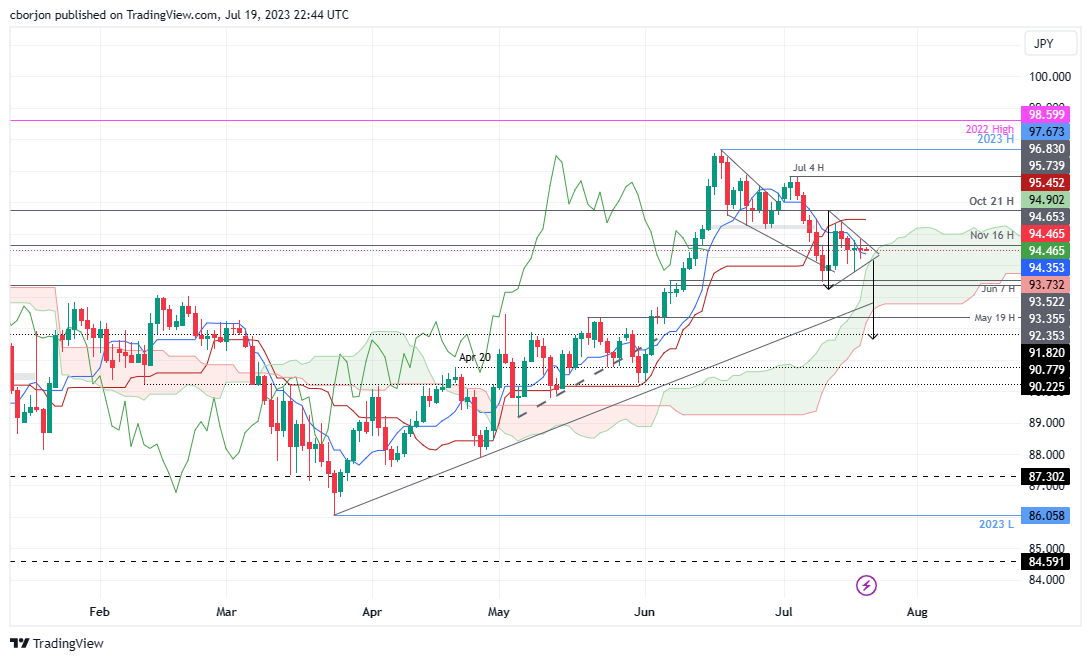
AUD/JPY consolidates around 94.50 as descending triangle suggests a downside break
- AUD/JPY fluctuates around the 94.50 area, indicating a lack of a strong catalyst for a breakout.
- A descending symmetrical triangle hints at a potential drop, targeting 92.00.
- On the upside, if a breakout occurs, resistance is at the Kijun-Sen at 95.45, 95.00, and 96.00.
AUD/JPY hovers around the 94.50 area for the fifth straight day, fluctuating above/below the latter amidst the lack of a strong catalyst that would trigger a breakout. As the Asian session begins, the AUD/JPY exchanges hand at 94.51.
AUD/JPY Price Analysis: Technical outlook
The AUD/JPY daily chart portrays the pair as neutral to bullish biased. Still, it could resume downwards as a descending symmetrical triangle has formed nearby the Ichimoku Cloud (Kumo). which could open the door for further downside. If the AUD/JPY breaks downwards, as measured by triangle patterns, the minimum objective would be the 92.00 figure, though, on its way south, the cross-currency pair must reclaim key support levels.
The AUD/JPY first support would be the Tenkan-Sen line at 94.35, followed by the 94.00 figure. A breach of the latter will expose the top of the Kumo at around 93.65/85, followed by the December 13 high at 93.52. With an AUD/JPY further extension downwards, the next demand area would emerge at the May 19 daily high at 92.35 before challenging the 92.00 figure.
Conversely, if the AUD/JPy breaks to the upside, the first supply area will emerge at the Kijun-Sen at 95.45, exposing the 95.00 psychological level once cleared. Following a break of that level, the AUD/JPY would have a clear path to rally towards the 96.00 figure before testing the July 4 daily high at 96.83.
AUD/JPY Price Action – Daily chart
