NZD/USD remains pressured amid US Dollar strength, despite high NZ inflation
- US housing data disappointed investors with June’s Housing Starts falling -8.0% MoM, despite May’s revised increase of 15.7%.
- New Zealand’s Q2 Consumer Price Index (CPI) dropped to 6.0% YoY from 6.7% following the Reserve Bank of New Zealand’s (RBNZ) decision to keep rates unchanged.
- NZD/USD initially increased following the inflation data release but later reversed as the Eurozone and UK also showed decelerating inflation, boosting the USD.
NZD/USD remains depressed as Thursday’s Asian session begins, following Wednesday’s fall of 0.15%, printing a new weekly low of 0.6225. Broad US Dollar (USD) strength, despite a high inflation report in New Zealand (NZ), was the main reason that weakened the NZD/USD pair, which is exchanging hands at 0.6262, down 0.01%.
NZD/USD records weekly low as broad USD strength outweighs New Zealand’s inflation report
A light economic docket in the US witnessed housing data’s release, as Housing Starts for June disappointed investors, falling -8.0% MoM, after a revised 15.7% May numbers. It should be said the housing market continues to recover despite 500 bps of Fed tightening. In the same tone, Building Permits slipped -3.7% MoM, well below May’s 5.6% growth.
In the meantime, the release of inflation data in NZ underpinned the NZD/USD, but later, the move was reversed. The Reserve Bank of New Zealand (RBNZ) keeping rates unchanged at the latest meeting is still lingering in the NZD/USD traders as inflation data revealed the Consumer Price Index (CPI) dropped from 6.7% YoY to 6.0% in the second quarter of 2023.
Given the fundamental backdrop, the NZD/USD initially printed a daily high, but as inflation data releases followed New Zealand’s path, with the Eurozone (EU) and the United Kingdom (UK) decelerating, bolstering the US Dollar (USD), sought by traders amidst uncertainty in the financial markets.
Although the greenback recovered ground, as portrayed by the US Dollar Index (DXY), climbing 0.36% at 100.288, US Treasury bond yields tumbled. After the July meeting, investors seem convinced that the US Federal Reserve would finish tightening monetary conditions, with most economists estimating the Federal Fund Rates (FFR) to peak at around 5.25%-5.50, while expectations for the first Fed rate cut are foreseen in the spring of 2024.
NZD/USD Price Analysis: Technical outlook

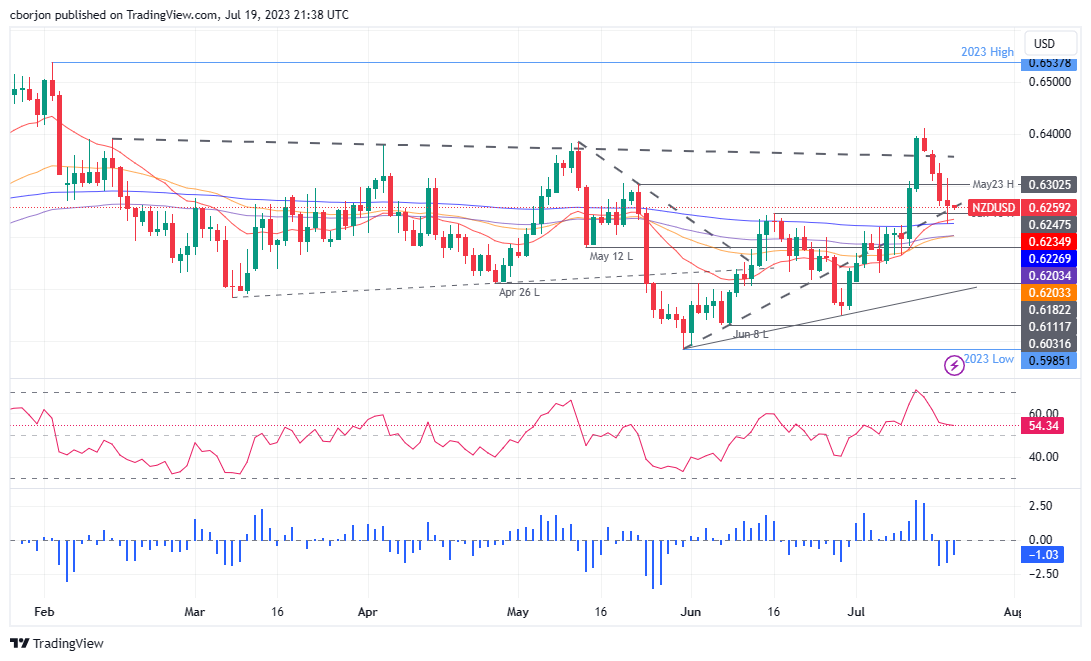
On Wednesday, the NZD/USD tumbled toward the confluence of the 20 and 200-day Exponential Moving Averages (EMAs) at 0.6235 and 0.6226. Still, buyers stepped in as the pair resumed its uptrend but failed to achieve a daily close above its opening price. Nevertheless, a large pin-bar candlestick could suggest the NZD/USD’s uptrend would resume, but buyers must reclaim key resistance levels on their way north. Firstly, the 0.6300 figure, followed by the July 19 daily high at 0.6314, which, once cleared, could open the door for an upside move toward the 00.6350, ahead of the 0.6400 mark. On the downside, the NZD/USD’s first support would be the 0.6250 psychological level before dropping to 0.6200.