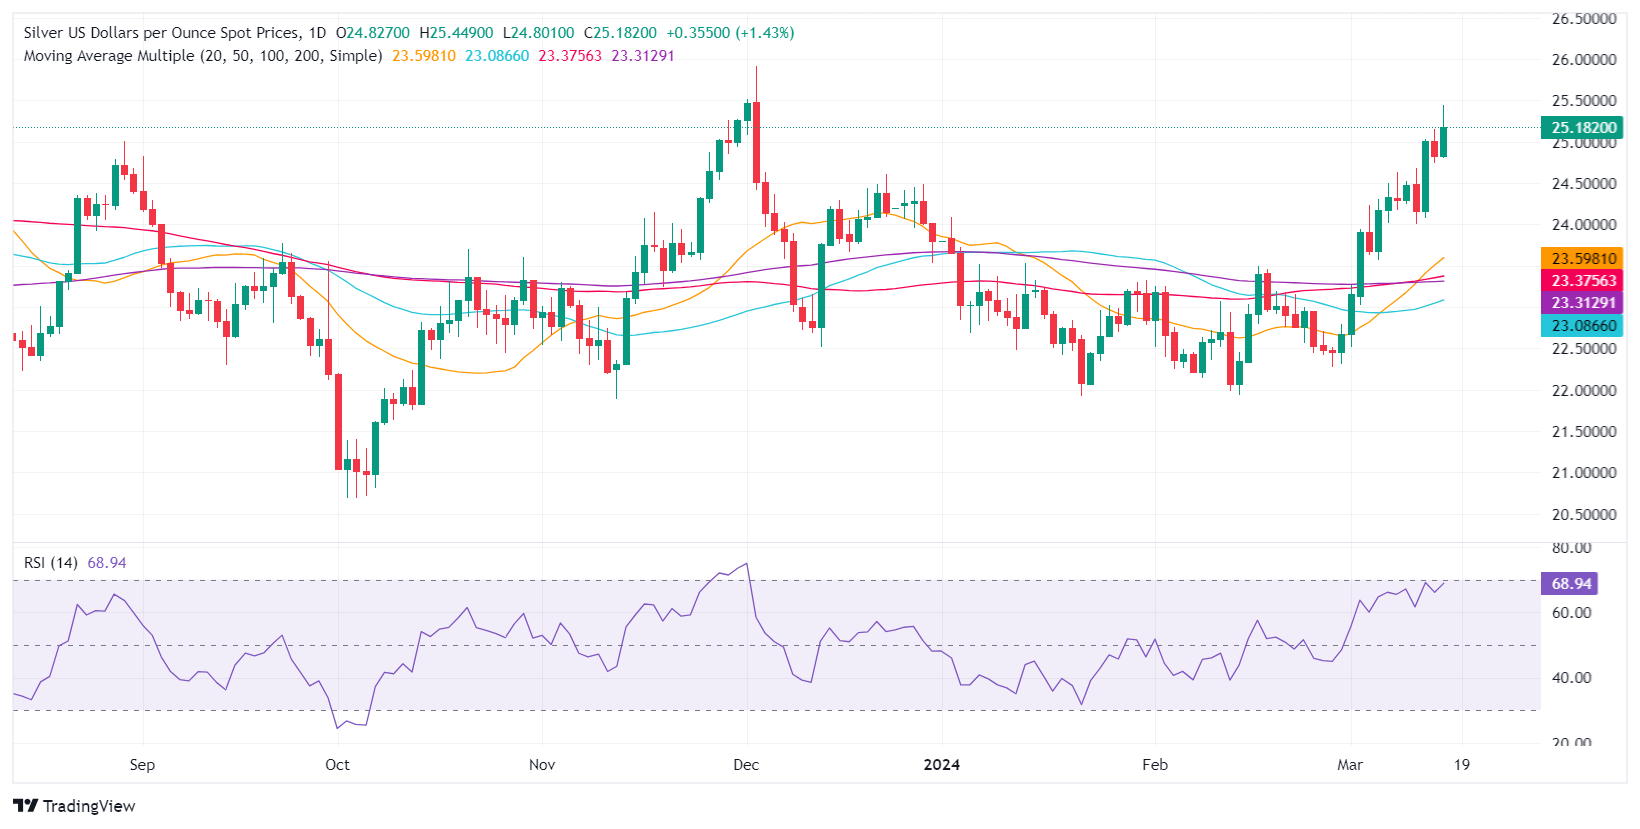
Silver Price Analysis: XAG/USD retreats toward $25.00, forms a ‘bearish harami’ candle pattern
- Silver price dips affected by an uptick in US Treasury yields and a stronger Dollar ahead of the Fed's decision.
- 'Bearish harami' pattern suggests potential declines if support breaks.
- Staying above $25.00 may boost bullish momentum, eyeing $26.00 resistance.
Silver's price dropped toward $25.00 a troy ounce on Monday as US Treasury bond yields rose ahead of the Federal Open Market Committee (FOMC) meeting. The US 10-year Treasury bond yield advance underpins the Greenback, a headwind for the precious metal. Therefore, XAG/USD trades at around $25.03, down by 0.57% at the time of writing.
XAG/USD Price Analysis: Technical outlook
The grey metal daily chart formed a ‘bearish harami’ candlestick chart pattern that suggests prices might edge to the downside, though sellers need to extend Silver’s losses beneath the March 15 swing low of $24.79. It should be said that the Relative Strength Index (RSI) indicator was barren from entering overbought conditions, keeping its bullish bias intact. However, the RSI edges lower, and if XAG/USD falls below $25.00, that might open the door to challenge December’s 22 high turned support at $24.60. Further downside is seen at $24.00.
On the other hand, if buyers hold XAG/USD spot price above $25.00, that could open the door to test the current year-to-date (YTD) high of $25.44 ahead of $26.00.
XAG/USD Price Action – Daily Chart
