Silver Price Analysis: XAG/USD eases from multi-day peak, sticks to gains below $23.00
- Silver scales higher for the third straight day, albeit fails to find acceptance above $23.00.
- The mixed hourly/daily oscillators warrant some caution before placing any directional bets.
- A sustained break back below the $22.65 confluence will negate prospects for further gains.
Silver gains some positive traction for the third successive day on Tuesday and climbs to a four-day high during the early part of the European session, though struggles to capitalize on the momentum or find acceptance above the $23.00 mark.
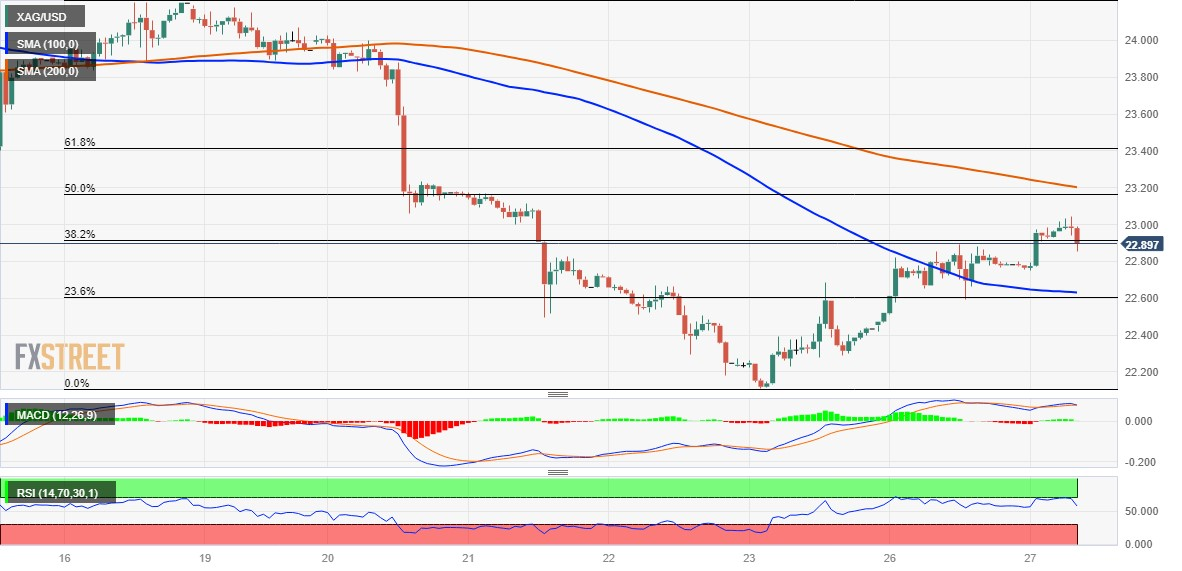
Against the backdrop of the overnight break through the 100-hour Simple Moving Average (SMA), for the first time since last Tuesday, bullish technical indicators on hourly charts support prospects for further intraday gains. However, oscillators on the daily chart - though have been recovering from lower levels - are yet to confirm a positive outlook and warrant some caution before placing fresh bullish bets around the XAG/USD.
In the meantime, any meaningful downside now seems to find some support near the $22.65 region, or the 100-hour SMA. The said area nears the 23.6% Fibonacci retracement level of the downfall witnessed over the past week or so, which if broken will shift the near-term bias back in favour of bearish traders. The XAG/USD might then turn vulnerable to retest the multi-month low, around the $22.10 region touched last week.
Some follow-through selling below the $22.00 mark will make the XAG/USD vulnerable to accelerate the fall further towards the $21.70-$21.65 support zone. The downward trajectory could get extended towards the next relevant support near the $21.25 area en route to the $21.00 round-figure mark.
On the flip side, any subsequent move beyond the $23.00 mark is likely to confront a stiff barrier near the $23.20-$23.25 confluence, comprising the 61.8% Fibo. level and the 200-hour SMA. This is followed by 61.8% Fibo. level, around the $23.40 region, which if cleared decisively will confirm that the XAG/USD has formed a bottom ahead of the $22.00 mark and pave the way for a further near-term appreciating move.
Silver 1-hour chart

Key levels to watch