AUD/JPY Price Analysis: Aussie soars, buyers start to back off on the hourly chart
- The daily chart presents a strong buying momentum with indicators deep in positive territory.
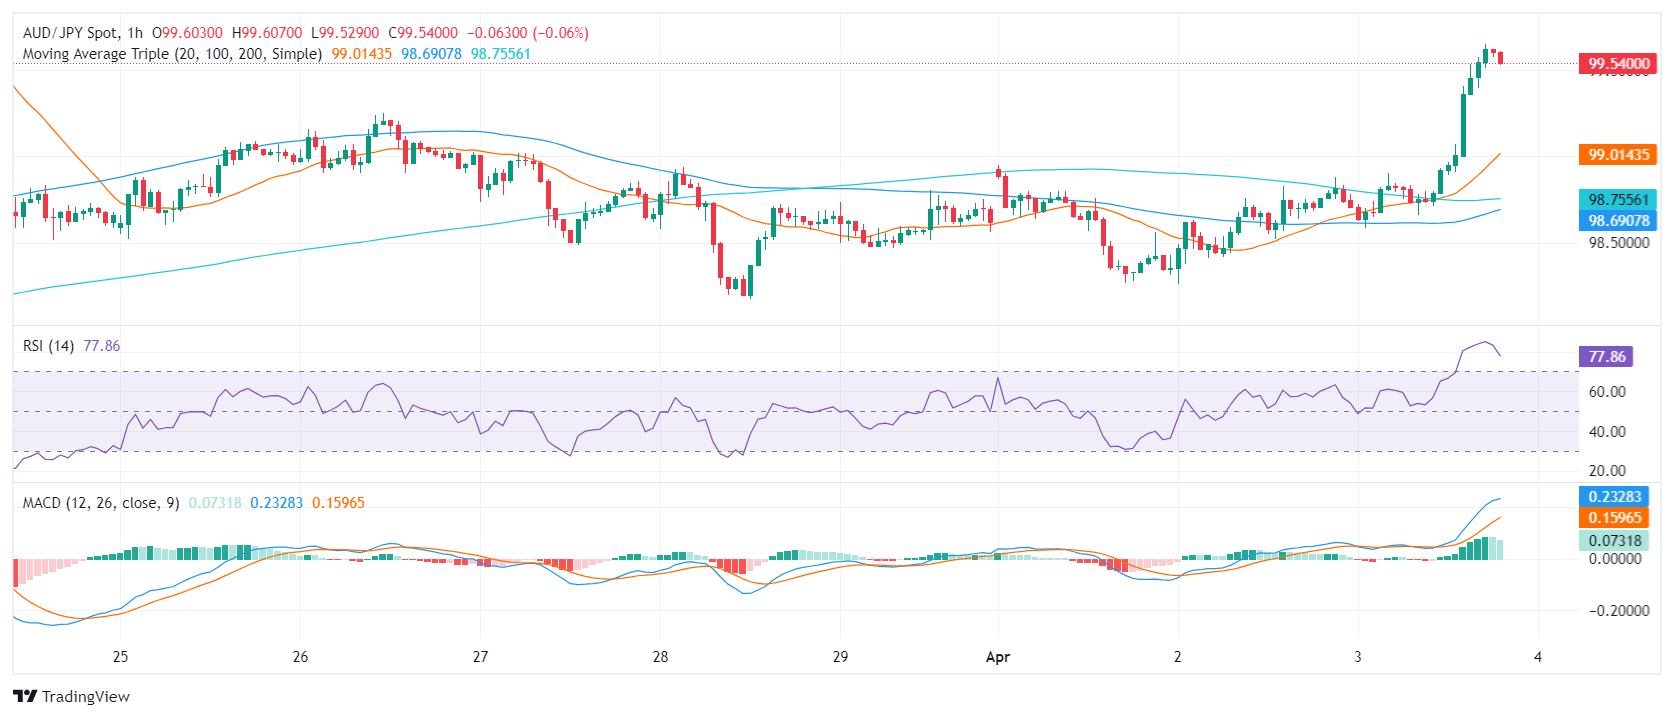
- On the hourly chart, the RSI resides in the overbought zone, suggesting a short-term consolidation of the recent gains.
In Wednesday's session, the AUD/JPY pair is trading at 99.58, following an increase of 0.82%. Buyers appear in control, but indicators are flashing signals of a short-term consolidation.
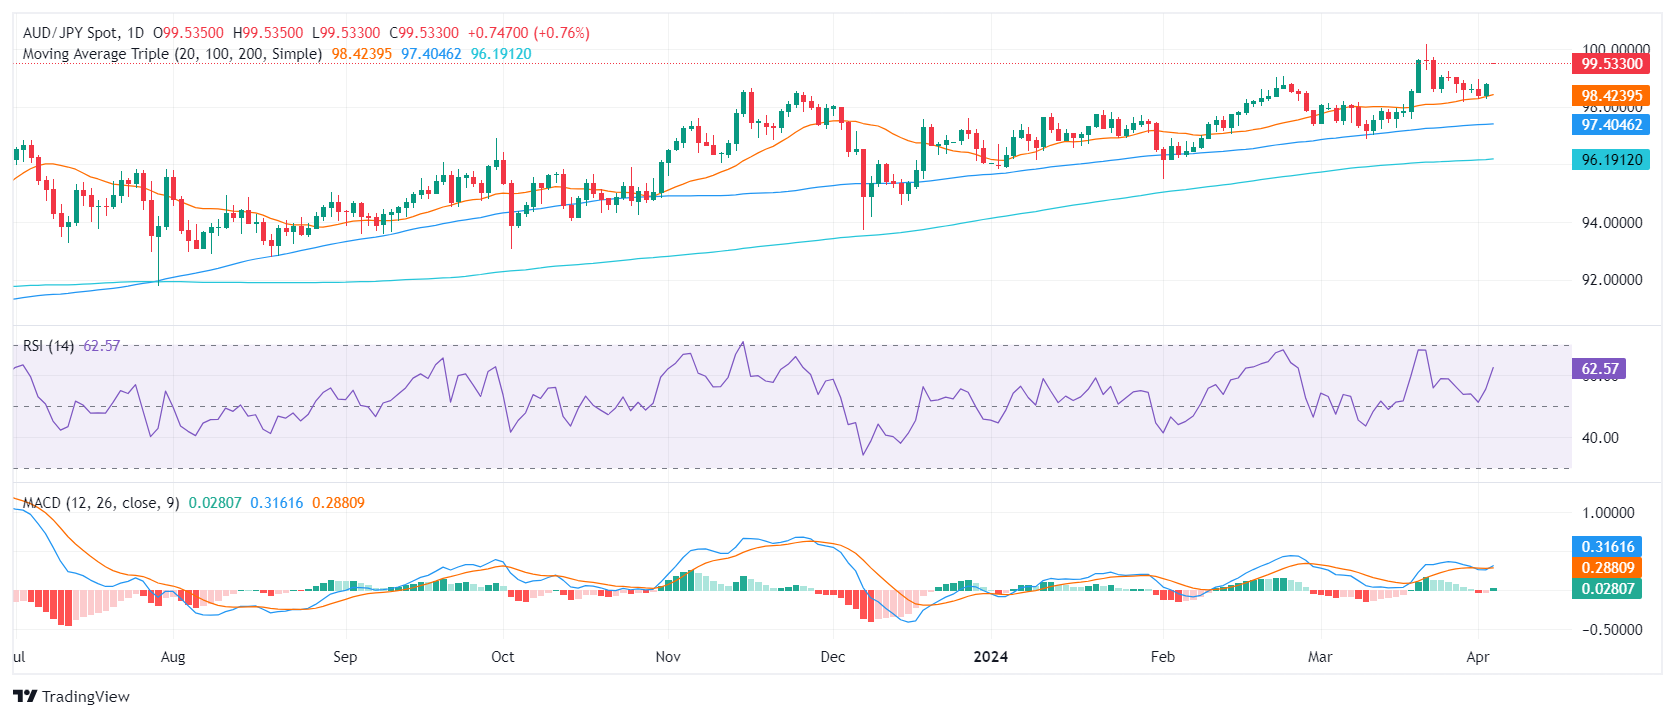
On the daily chart, the AUD/JPY pair reveals a bullish sentiment. The Relative Strength Index (RSI) resides deep in positive territory, with recent readings reaching as high as 61, indicating the domination of buyers in the market. Furthermore, the rising green bars on the Moving Average Convergence Divergence (MACD) histogram show a positive momentum, supporting the bullish outlook.
AUD/JPY daily chart

Upon inspecting the hourly chart, the RSI readings consistently hover in the overbought zone, with the latest entry at 78 but the index has started to edge downwards. A flat green histogram on the MACD also gives arguments for a short-term consolidation.
AUD/JPY hourly chart

Considering the broader outlook, the pair also stands above the 20,100 and 200-day Simple Moving Averages (SMAs). This setup suggests short-term and long-term trends are bullish, and traders may expect further upside.
In conclusion, both daily and hourly charts for the AUD/JPY pair highlight a bullish outlook. The RSI values and the MACD histograms across both timelines point to strong upward movement, with buyers currently holding market reins. However, indicators on the hourly chart point to further consolidation as they lie deep in the overbought zone.