Silver Price Analysis: XAG/USD peaks to new three-year high above $27.00
- Silver's surge to multi-year highs reflects strong precious metals momentum, undeterred by US job market.
- Technical outlook hints at more gains, with resistances at $27.50, $28.00.
- RSI dip may prompt support tests at $27.00, $26.12 for future direction clues.
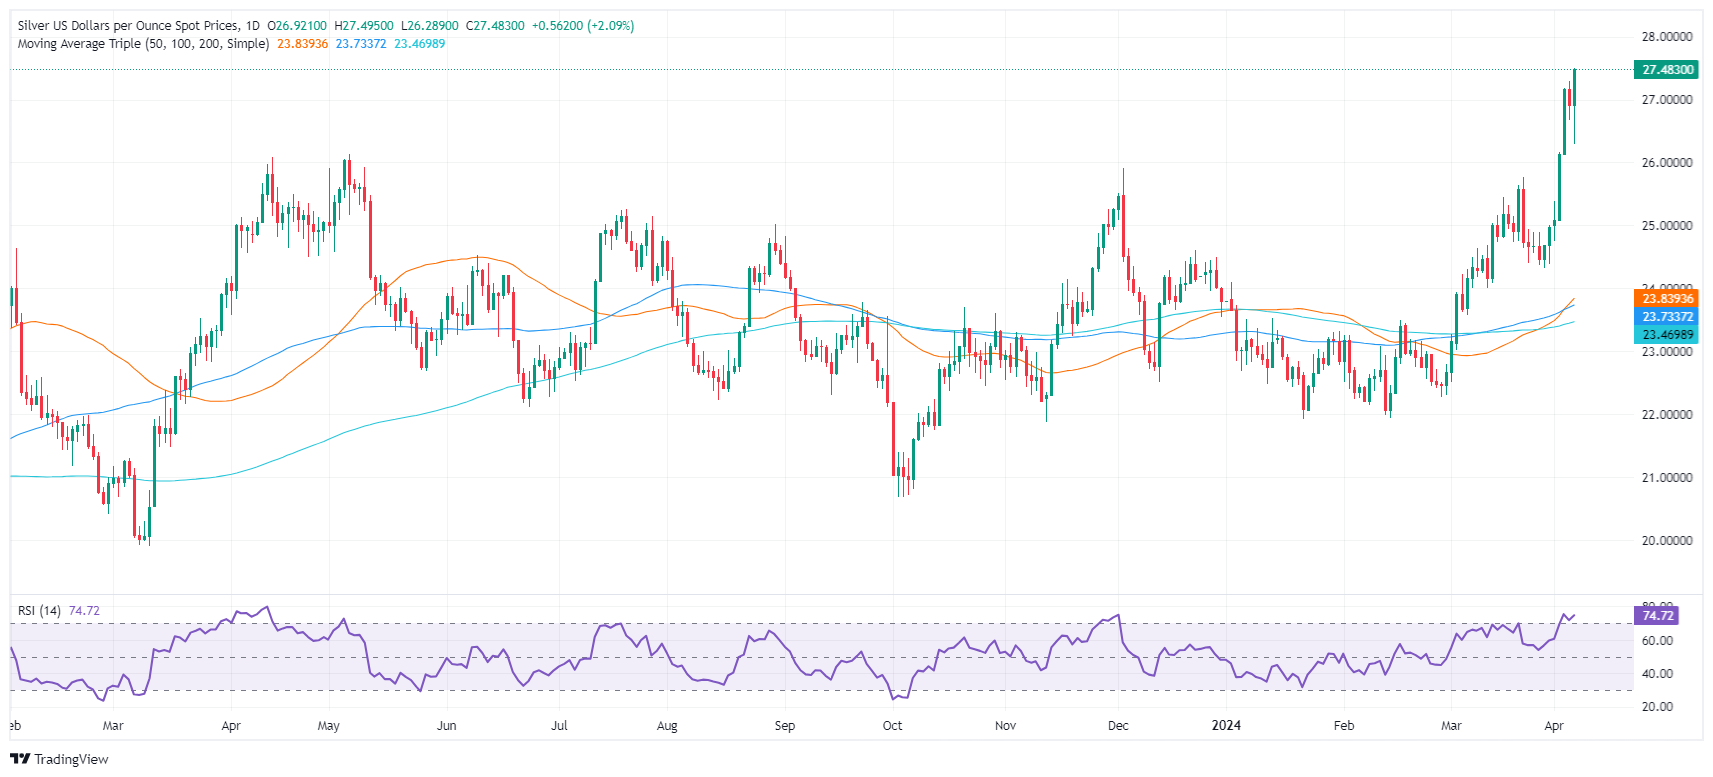
Silver soared sharply and finished the week with gains of close to 10%, hitting three-year highs after reaching levels last seen in June 2021. At the time of writing, XAG/USD trades at $27.45 a troy ounce, gaining more than 2%.
The precious metals segment ignored an upbeat US jobs report that might delay the Federal Reserve from slashing rates in the June meeting. According to the CME FedWatch Tool, market participants decreased their bets on a quarter-percentage-point rate cut in June, though July remains in play. Silver followed Gold’s path, though the latter is trading at all-time highs.
XAG/USD Price Analysis: Technical outlook
The grey metal daily chart shows Silver dipped as low as $26.29 after the US NFP release but, in the aftermath, rallied to multi-year highs. The Relative Strength Index (RSI) despite being at overbought conditions, aims up, an indication that buyers are gathering momentum. That said, XAG/USD next resistance would be $27.50, followed by the $28.00 psychological mark. Key resistance lies at June 10, 2021, high at $28.28.
On the other hand, if the RSI punches below the 70 level, that could sponsor a pullback, toward the $27.00 figure. The next support would be the May 5, 2023 high turned support at $26.12, followed by the $26.00 figure.
XAG/USD Price Action – Daily Chart
