NZD/USD Price Analysis: Bears weaken as bullish momentum hints at possible recovery
- The daily chart reveals a shift in NZD/USD from a bearish to a bullish short-term outlook.
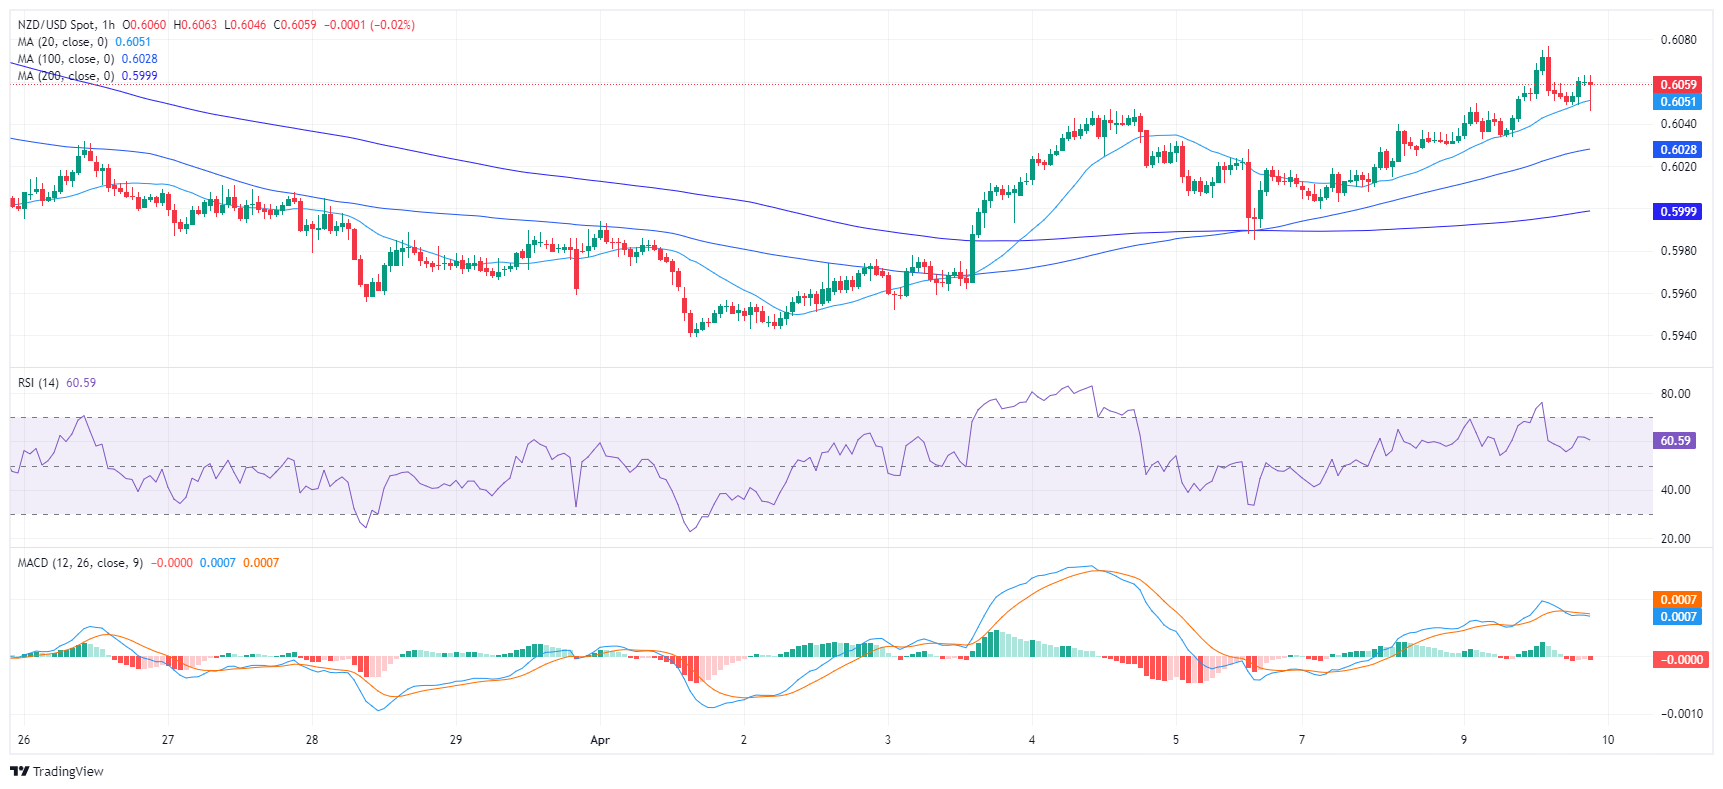
- Hourly chart indicators echo the bullish trend visible in the daily analysis.
- Buyers will need to claim dominance over key SMAs to make strides in the market.
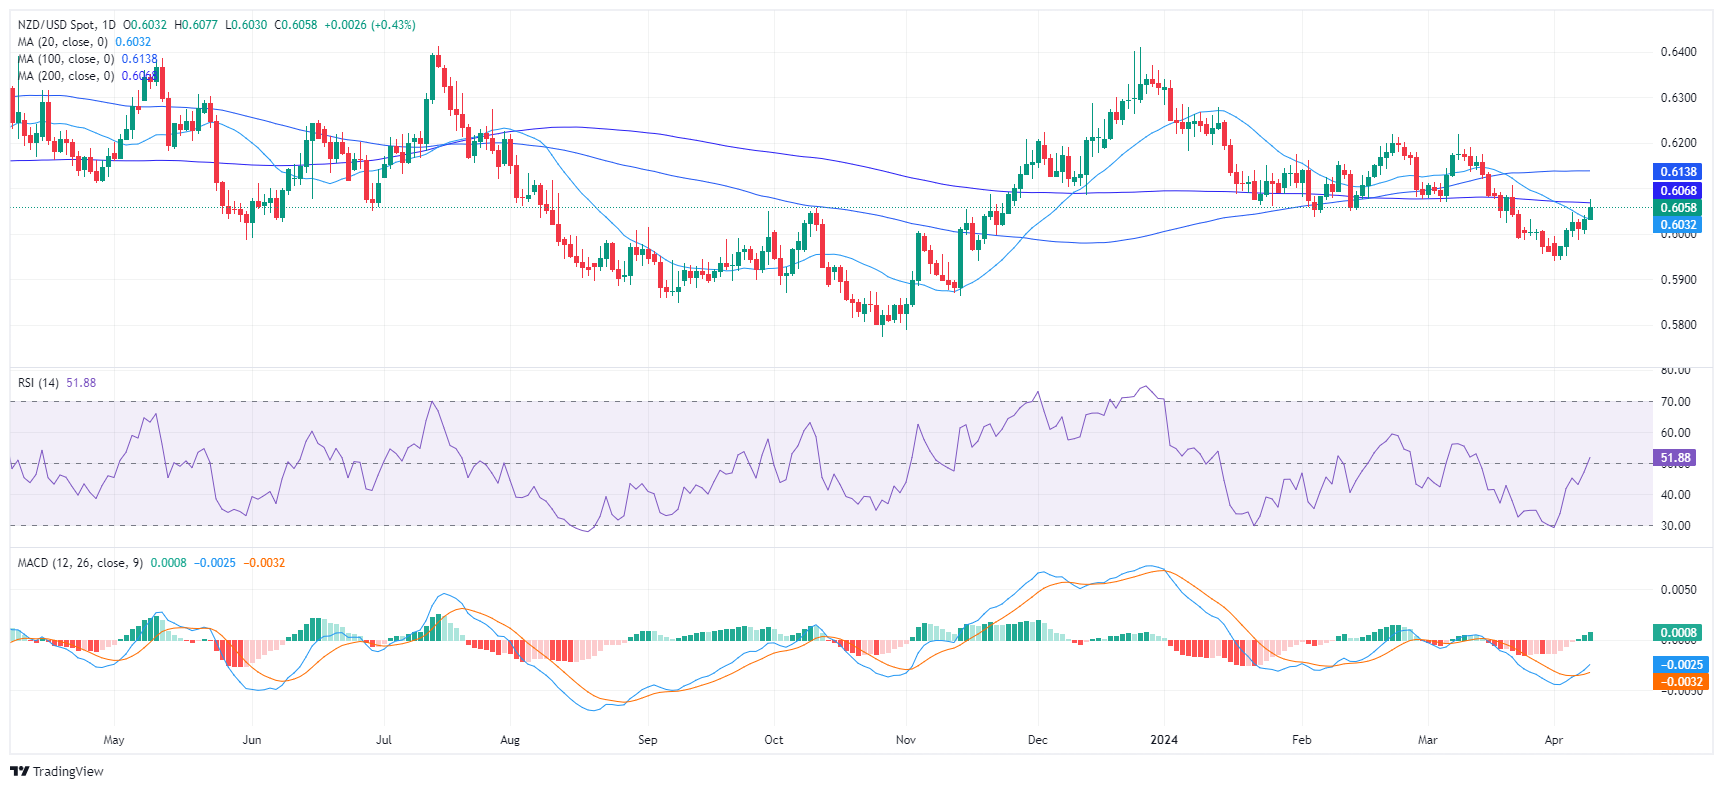
The NZD/USD rose to around 0.6058, reflecting a 0.41% gain on Tuesday's session. Despite the pair experiencing a momentum shift from bearish to bullish, it is positioned beneath key Simple Moving Averages (SMAs), hinting at a possible extended downtrend.
On the daily chart, the Relative Strength Index (RSI) rose from negative territory and is now within the positive zone. This indicates a reversal from a bearish trend to a bullish short-term outlook. Further strengthening that, the Moving Average Convergence Divergence (MACD) histogram prints rising green bars for the first time since mid-March, signaling a potential upward momentum.
NZD/USD daily chart

Turning to the hourly chart, the RSI is on the rise, mirroring the trend found on the daily chart. The MACD histogram on the hourly scale is relatively flat but displays red bars, indicating a mild negative momentum, probably hinting that the bulls are taking profits after the RSI hit overbought conditions earlier in the session.
NZD/USD hourly chart

Regarding the overall trend, the NZD/USD has demonstrated a significant jump above its 20-day Simple Moving Average (SMA), suggesting a bullish shift in the short-term outlook. This development indicates that the pair has found some near-term buying strength. However, it continues to be positioned below both the 100 and 200-day SMA, implying a long-term bearish stance. Further to this, the pair was recently rejected by its 100-day SMA at 0.6138, suggesting a reinforced resistance at this level. A sustained move above this level would be required to alter the overall bearish bias.