USD/CHF Price Analysis: Inside the woods maid uncertainty over Fed’s policy outlook
- USD/CHF is trading back and forth in a limited range as investors are mixed about Fed’s monetary outlook.
- S&P500 futures have surrendered some gains, however, the overall market mood is quite bullish.
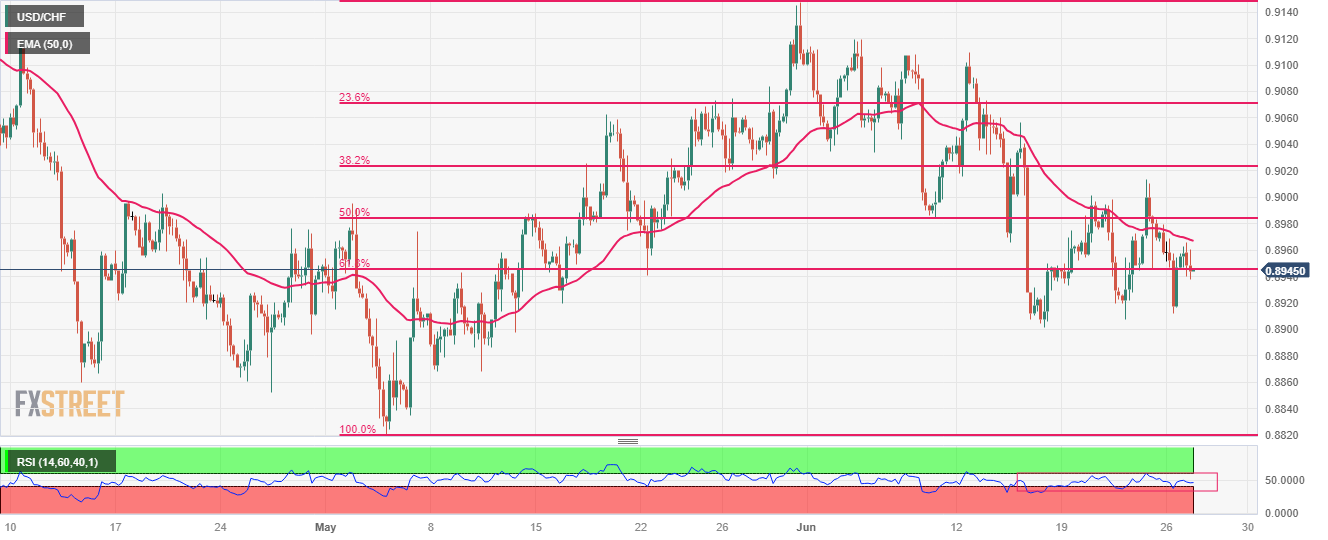
- USD/CHF is making efforts for keeping itself above the 61.8% Fibonacci retracement at 0.8946.
The USD/CHF pair is showing topsy-turvy moves in a range of 0.8940-0.8960 in the European session. The Swiss Franc asset has turned non-directional amid uncertainty about the monetary policy outlook by the Federal Reserve (Fed).
S&P500 futures have surrendered some gains, however, the overall market mood is quite bullish as investors are shifting their focus from fears of global recession to the upcoming quarterly result season.
The US Dollar Index (DXY) is in a correction phase and has dropped to near 102.50. Investors should note that the downside momentum in the USD Index is weak, portraying that investors are awaiting a fresh trigger for further guidance.
USD/CHF is making efforts for keeping itself above the 61.8% Fibonacci retracement (plotted from May 04 low at 0.8820 to May 31 high at 0.9148) at 0.8946 on a four-hour scale. The 50-period Exponential Moving Average (EMA) at 0.8967 is acting as a barricade for the US Dollar bulls.
A range oscillation in the 40.00-60.00 territory by the Relative Strength Index (RSI) (14) indicates a sideways performance.
Going forward, a breakdown below May 12 low around 0.8900 would expose the Swiss Franc asset to April 13 low at 0.8860 followed by the ultimate support plotted from May 04 low at 0.8820.
In an alternate scenario, an upside move above the psychological resistance of 0.9000 would fade the bearish bias and will drive the asset toward June 06 low at 0.9033 and May 30 high at 0.9084.
USD/CHF four-hour chart
