EUR/USD declines after delay following PCE data beat
- EUR/USD declines after a delay following the release of US PCE data.
- Core Personal Expenditures Price Index for March beats estimates.
- EUR/USD first edges higher but then weakens after the report.
EUR/USD trades back below 1.0700 on Friday as traders digest the implications of the March core Personal Consumption Expenditures Price Index (PCE), the US Federal Reserve’s (Fed) preferred gauge of inflation.
The pair popped higher immediately after the report was released but then broke substantially lower, falling back below the key 1.0700 handle, after core PCE data showed a higher-than-expected reading of 2.8% YoY, when analysts had expected 2.6% from 2.8% previously, according to the US Bureau of Economic Analysis (BEA). On month, Core PCE rose 0.3% in line with expectations and the same as previously.
Following the release, the probability of the Federal Reserve making an interest-rate cut in September from 59% on Friday morning prior to the event to 60% after.
Other data in the PCE report showed headline Personal Consumption Expenditures Price Index rising to 2.7%, beating estimates of 2.6% and a prior reading of 2.5%. On month, the PCE rose 0.3% as expected and the same as previous.
Personal Income rose 0.5% as forecast and Personal Spending 0.8%, beating estimates of 0.6% and the same as previous.
EUR/USD recovers from post-GDP data decline
EUR/USD declined sharply to a low of 1.0678 on Thursday following the release of US first-quarter GDP data. Although annualized GDP growth missed consensus expectations and fell below the previous quarter’s growth rate, the Personal Consumption Expenditures Prices component, which measures the change in prices of goods, came in way higher compared with previous quarter and supported the US Dollar (USD).
The inflationary data meant that markets dialed back their expectation of when the Federal Reserve (Fed) will start cutting interest rates, with the chance of a rate cut by the July meeting falling from 50% on the previous day to 34% afterwards, according to analysts at Deutsche Bank.
The expectation of interest rates staying higher for longer temporarily strengthened the Greenback – but weighed on EUR/USD – because higher interest rates attract more foreign capital inflows.
Technical Analysis: EUR/USD continues slowly correcting higher
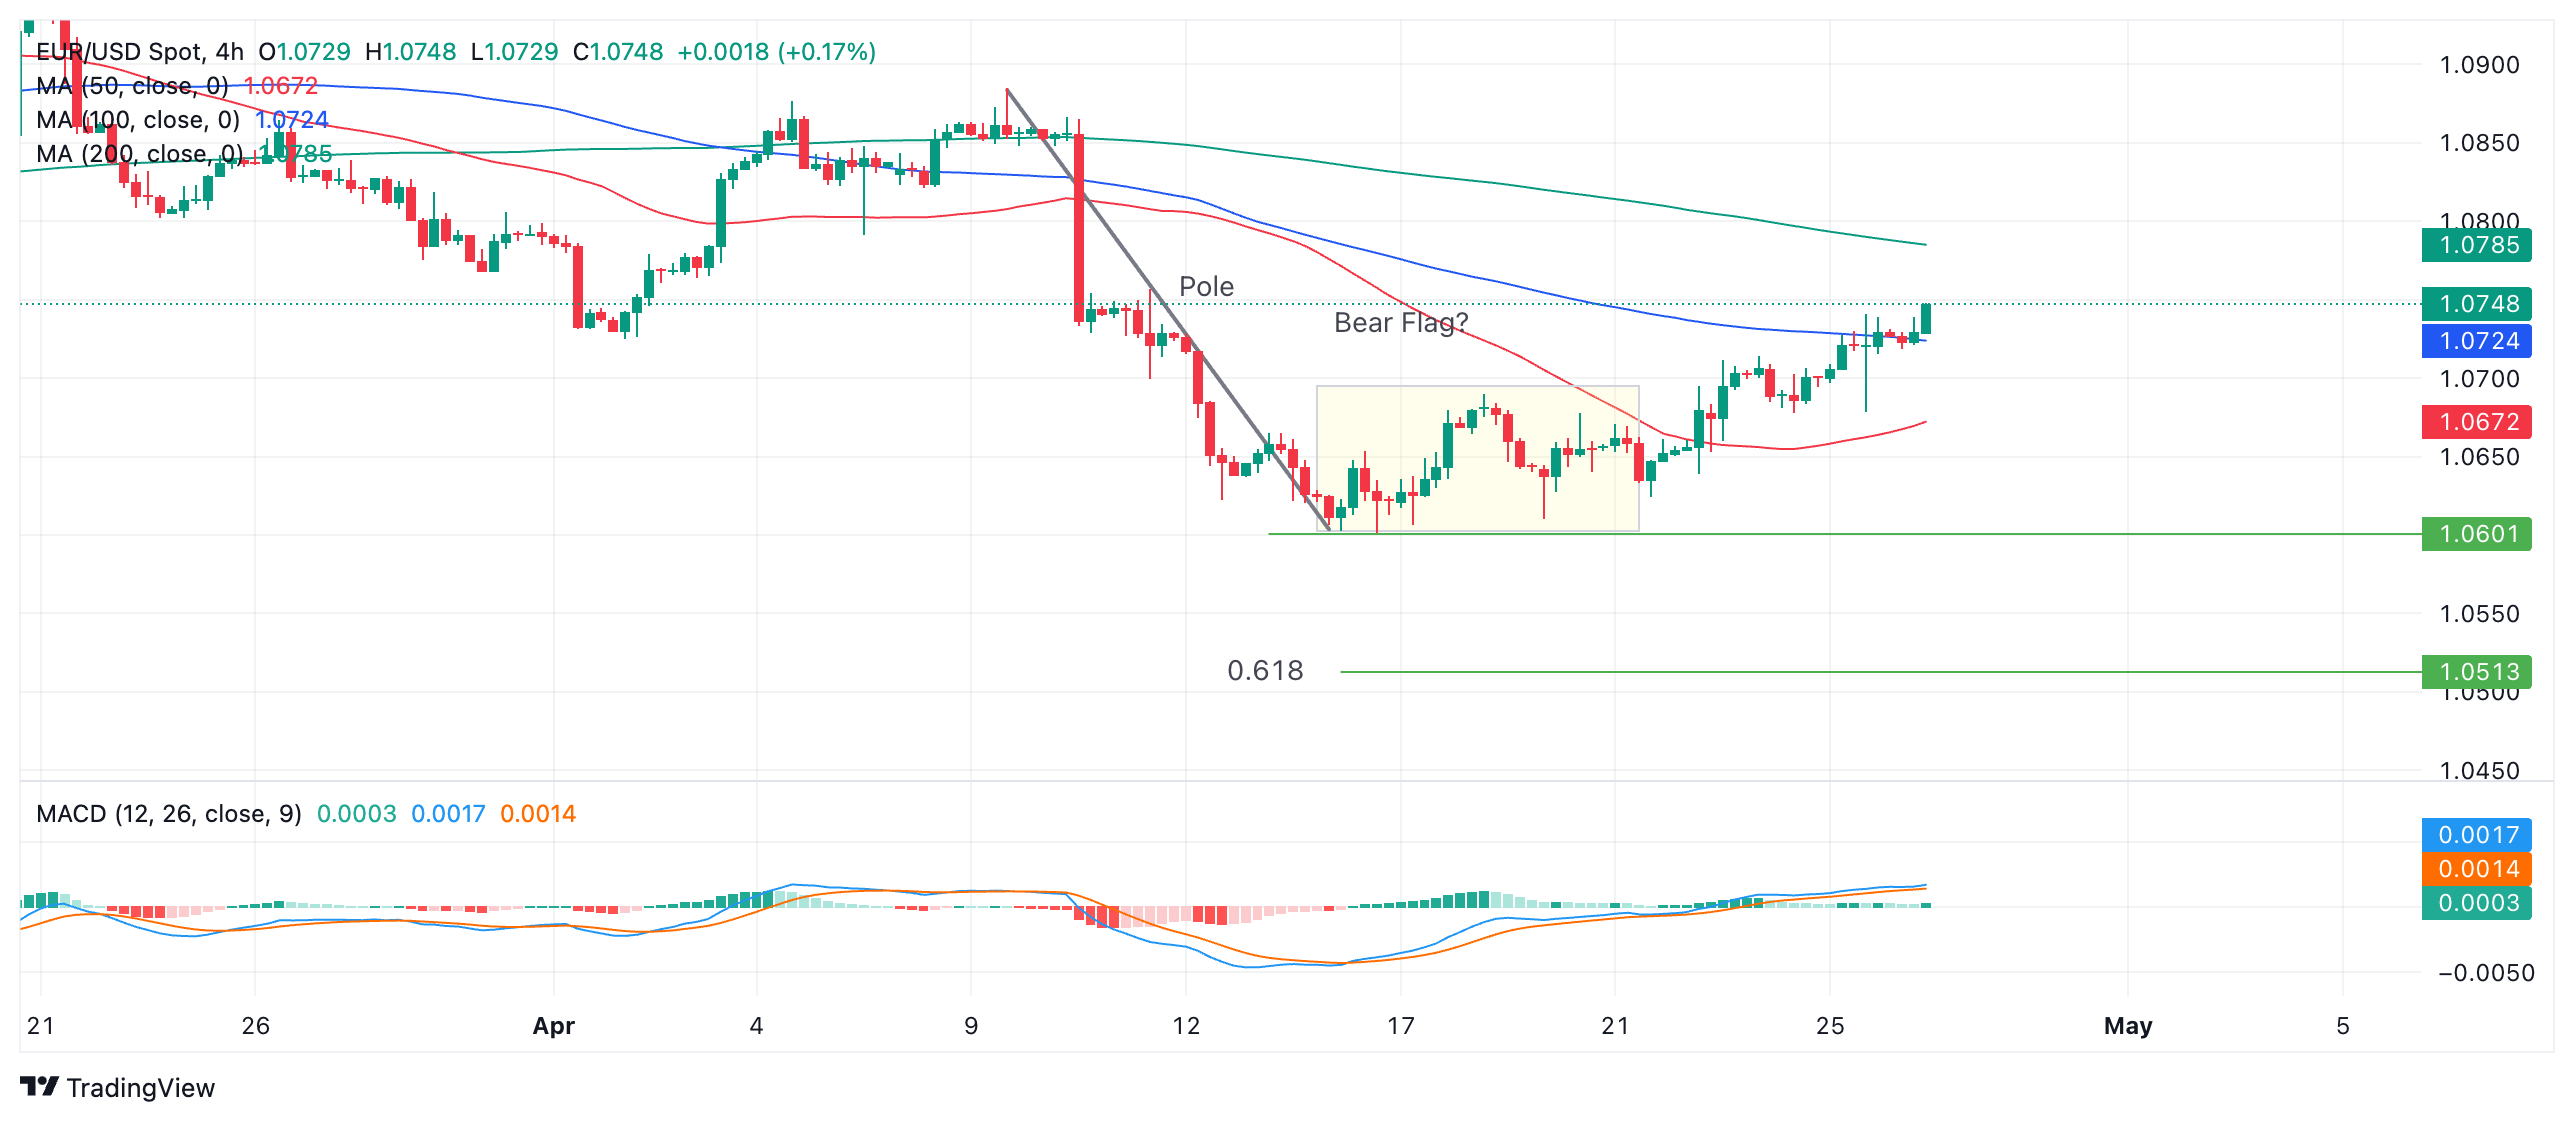
EUR/USD continues correcting higher despite experiencing a pullback down below the 1.0700 level after the release of US GDP data on Thursday.
It has broken out of the rectangular range it was trading in on the 4-hour chart after piercing above the rectangle’s ceiling at 1.0700.
The Bear Flag price pattern which was unfolding between April 16-22 looks deformed by the persistent price action above 1.0700 and is less credible.
EUR/USD 4-hour Chart

The establishment of a rising sequence of peaks and troughs on the 4-hour chart strengthens the argument that the short-term trend has turned bullish and therefore suggestive of more gains.
If it continues marching higher, resistance from a previous lower high on April 11 gives an initial target at 1.0757. Then the 50-day and 200-day Simple Moving Averages (SMA) on the daily chart (not shown) are likely to resist at 1.0807.
On the other hand, a break below the 1.0601 April 16 low would revive the Bear Flag hypothesis.
According to technical lore, the expected move down from a Bear Flag equals the length of the preceding “pole” or a Fibonacci ratio of the pole.
The Fibonacci 0.618 ratio of the pole extrapolated lower gives a conservative target at 1.0503. The next concrete target is at 1.0448 – the October 2023 low. A fall of equal length to the pole would take EUR/USD to 1.0403.
Fed FAQs
Monetary policy in the US is shaped by the Federal Reserve (Fed). The Fed has two mandates: to achieve price stability and foster full employment. Its primary tool to achieve these goals is by adjusting interest rates. When prices are rising too quickly and inflation is above the Fed’s 2% target, it raises interest rates, increasing borrowing costs throughout the economy. This results in a stronger US Dollar (USD) as it makes the US a more attractive place for international investors to park their money. When inflation falls below 2% or the Unemployment Rate is too high, the Fed may lower interest rates to encourage borrowing, which weighs on the Greenback.
The Federal Reserve (Fed) holds eight policy meetings a year, where the Federal Open Market Committee (FOMC) assesses economic conditions and makes monetary policy decisions. The FOMC is attended by twelve Fed officials – the seven members of the Board of Governors, the president of the Federal Reserve Bank of New York, and four of the remaining eleven regional Reserve Bank presidents, who serve one-year terms on a rotating basis.
In extreme situations, the Federal Reserve may resort to a policy named Quantitative Easing (QE). QE is the process by which the Fed substantially increases the flow of credit in a stuck financial system. It is a non-standard policy measure used during crises or when inflation is extremely low. It was the Fed’s weapon of choice during the Great Financial Crisis in 2008. It involves the Fed printing more Dollars and using them to buy high grade bonds from financial institutions. QE usually weakens the US Dollar.
Quantitative tightening (QT) is the reverse process of QE, whereby the Federal Reserve stops buying bonds from financial institutions and does not reinvest the principal from the bonds it holds maturing, to purchase new bonds. It is usually positive for the value of the US Dollar.