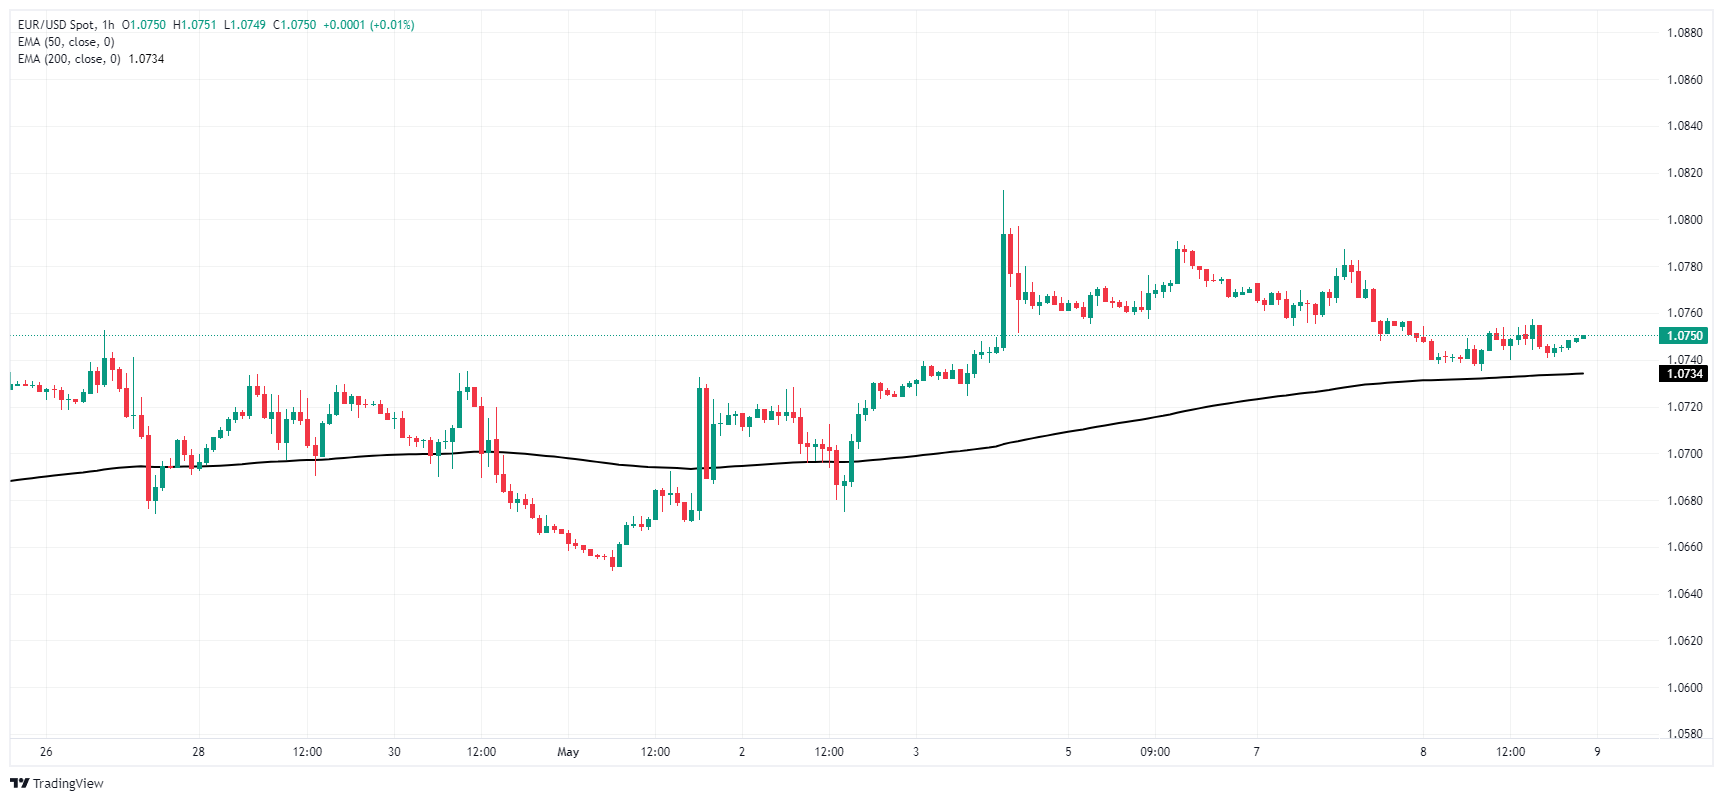
EUR/USD stuck near midrange ahead of thin Thursday session
- European markets to be thin on Thursday holiday.
- Economic calendar limited on both sides of the Atlantic.
- Broader markets continue to churn on rate cut expectations.
EUR/USD is reverting to the near-term mean, stuck near 1.0750 and stuck firmly in the week’s opening trading range. European market flows are set to be thin on Thursday with German and French markets shuttered for the Ascension Day holiday, and US data is set to be strictly mid-tier until Friday’s University of Michigan Consumer Sentiment Index.
Markets will be on the lookout for speeches from European Central Bank (ECB) policymakers, but ECB officials are broadly expected to avoid rocking the boat amidst holiday-constrained market flows. US Initial Jobless Claims for the week ended May 3 is expected during Thursday’s US market session, and markets are forecasting a slight uptick to week-on-week new jobless benefits claims to 210K from the previous week’s 208K.
This week’s key data release will be Friday’s US UoM Consumer Sentiment Index, which is expected to ease to 7.0 for the month of May, down slightly from the previous print’s 77.2. The UoM’s consumer outlook survey hit a two-and-a-half year high in March as the US economy continues to outperform market hopes for easing conditions to push the Federal Reserve (Fed) towards rate cuts.
EUR/USD technical outlook
EUR/USD continues to drift towards median bids, pulling closer to the 200-hour Exponential Moving Average (EMA) at 1.0734. The pair found thin bids early Wednesday, setting an intraday high of 1.0757 before flubbing bullish momentum and ending the day near 1.0750.
Daily candles reveal a bearish technical rejection firming up as EUR/USD gets pulled down after failing to break above the 200-day EMA at 1.0788. The pair’s near-term peak sits at 1.0813, and a continuation to the downside leaves the pair exposed to a decline to the last swing low into the 1.0600 handle.
EUR/USD hourly chart
EUR/USD daily chart