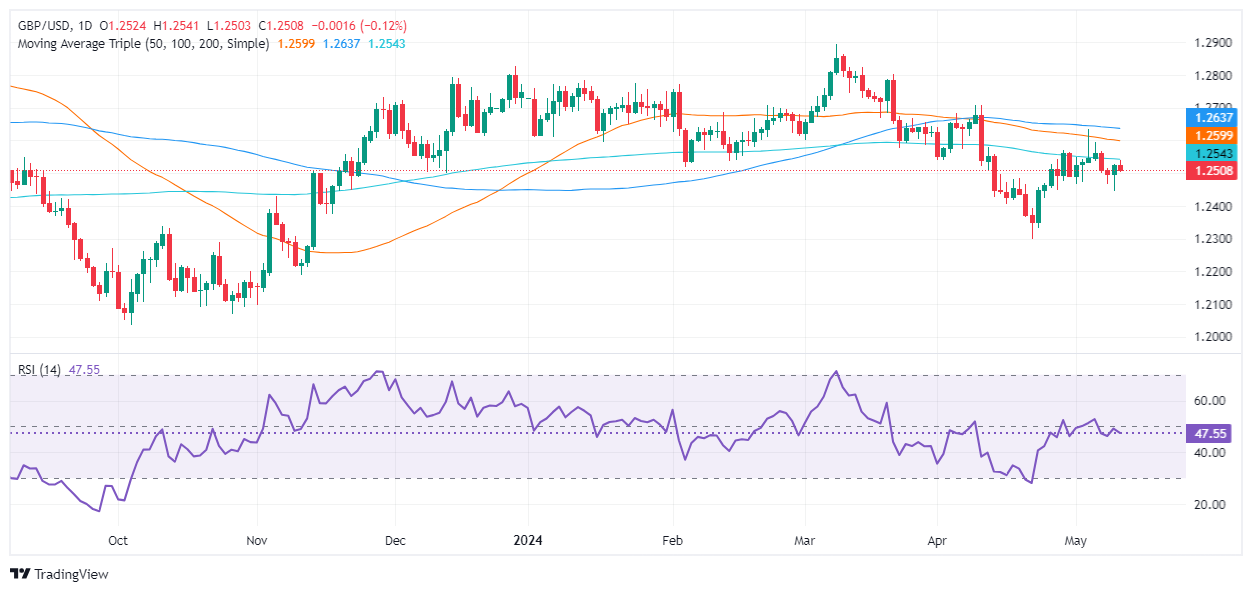
GBP/USD Price Analysis: Struggles at 200-DMA, retreats toward 1.2500
- GBP/USD erased its earlier gains as buyers failed to reclaim 200-DMA.
- Deterioration in the US economy spurred flows to USD amid its safe-haven appeal.
- Momentum remains bearish, as RSI stays below 50, key resistance lie above spot price.
The Pound Sterling weakened against the US Dollar on Friday, even though economic data from the UK was better than expected. Fears that the US economy may slow more sharply than expected as consumer sentiment deteriorates. The GBP/USD trades at 1.2510, down 0.10%.
GBP/USD Price Analysis: Technical outlook
From a technical standpoint, the GBP/USD retracement toward 1.2500 keeps sellers hopeful of lower spot prices. Buying momentum is fading as buyers failed to crack the 200-day moving average (DMA) at 1.2541. That and the Relative Strength Index (RSI) remaining bearish could pave the way for further losses.
For a bearish continuation, sellers must conquer the May 9 low of 1.2445. Once cleared, it would emerge the psychological 1.2400 level, followed by the year-to-date (YTD) low of 1.2299.
On the flip side, if buyers hold GBP/USD’s exchange rate above 1.2500, they could test the 200-DMA, followed by the 50-DMA at 1.2594. the next resistance would be the 100-DMA at 1.2635.
GBP/USD Price Action – Daily Chart
