Crude Oil recovers on Monday, but stuck in familiar territory as WTI grapples with $79
- Crude Oil rebounded to kick off the new trading week.
- Despite recovery, topside momentum remains limited.
- Geopolitical tensions are mixing poorly with increasing risk of oversupply.
West Texas Intermediate (WTI) US Crude Oil recovered ground on Monday as energy traders stepped back into barrel bets on continued geopolitical tensions in the Middle East, but steadily-rising US Crude Oil supplies are crimping upside potential in Crude Oil markets.
A ceasefire in the ongoing Israel-Palestinian Hamas conflict is proving to be a difficult task to accomplish, and Israeli forces continue to push into Palestinian territory. Israel’s refusal to accept a ceasefire deal are putting a floor beneath Crude Oil prices as investors remain wary of a potential spillover into neighboring regions crucial to global Crude Oil supply.
Despite renewed barrel buying on Monday, upside potential for Crude OIl remains limited as US production continues to outpace demand. According to the Energy Information Administration (EIA), US Crude Oil production in the Permian Basin is set to rise to its highest levels of barrel output since December of last year. Week-on-week barrel supply counts have steadily outrun forecasts as production overfills facilities, outrunning energy demand.
The American Petroleum Institute (API) will be publishing their latest Weekly Crude Oil Stocks count on Tuesday, forecast to show a buildup of one million barrels through the week ended May 10. The EIA’s own Crude Oil Stocks Change, due on Wednesday, will be publishing on Wednesday.
WTI technical outlook
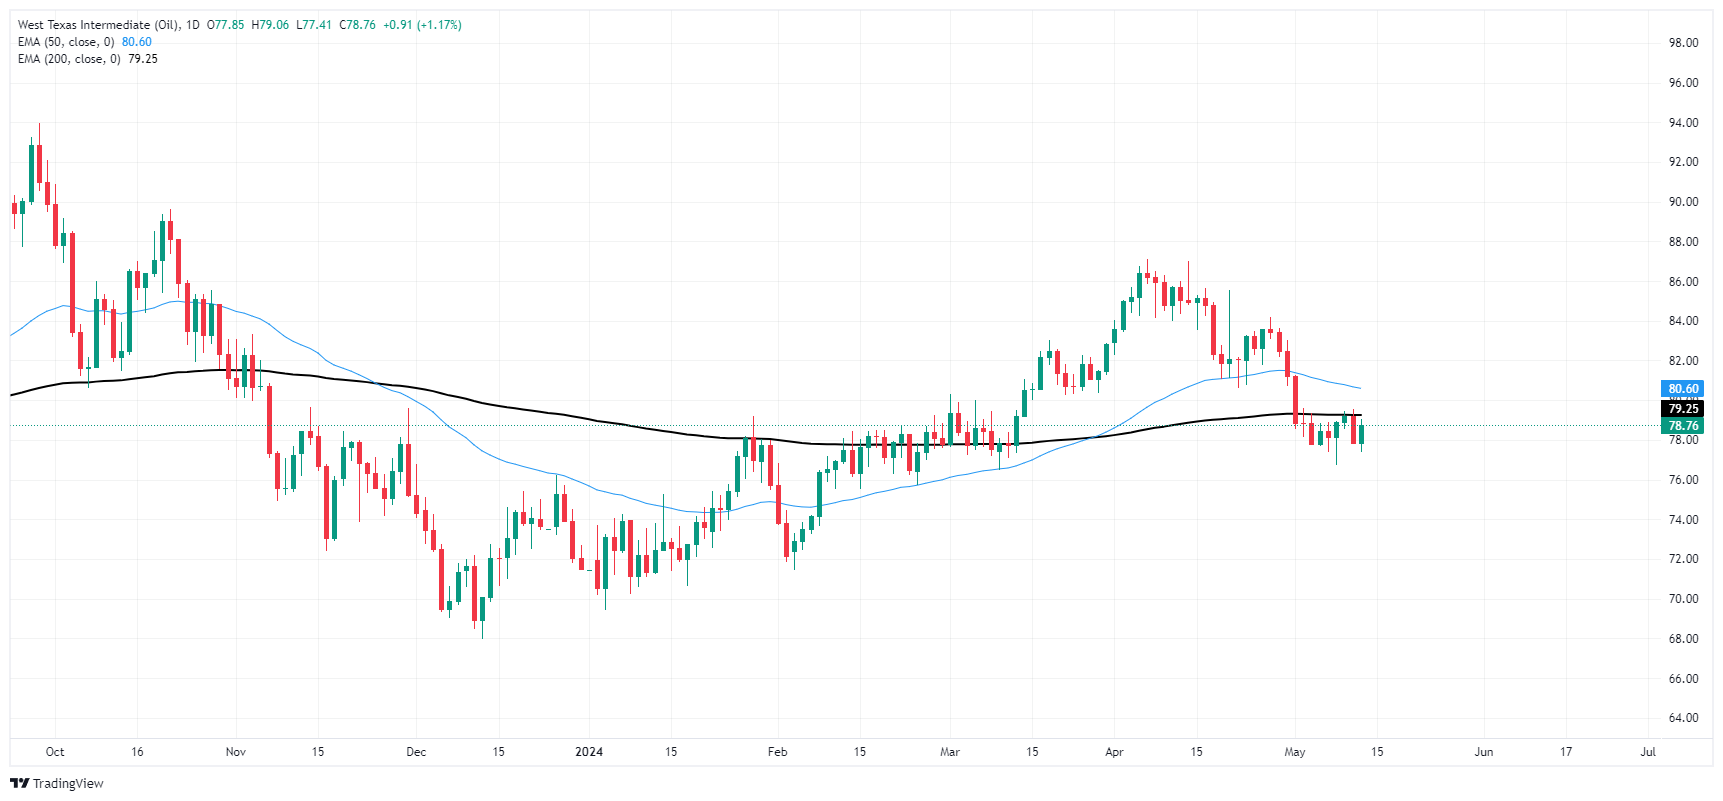
Despite Monday’s price recovery, WTI remains trapped in near-term technical levels as US Crude Oil trades on the high side of a supply zone between $78.00 and $77.00 per barrel. Bullish momentum is capped by the 200-hour Exponential Moving Average (EMA) at $79.08.
Daily candles remain hampered by the 200-day EMA at 79.25, and Crude Oil is struggling to develop bullish legs after falling from the last swing high above $86.00 per barrel.
WTI hourly chart
WTI daily chart