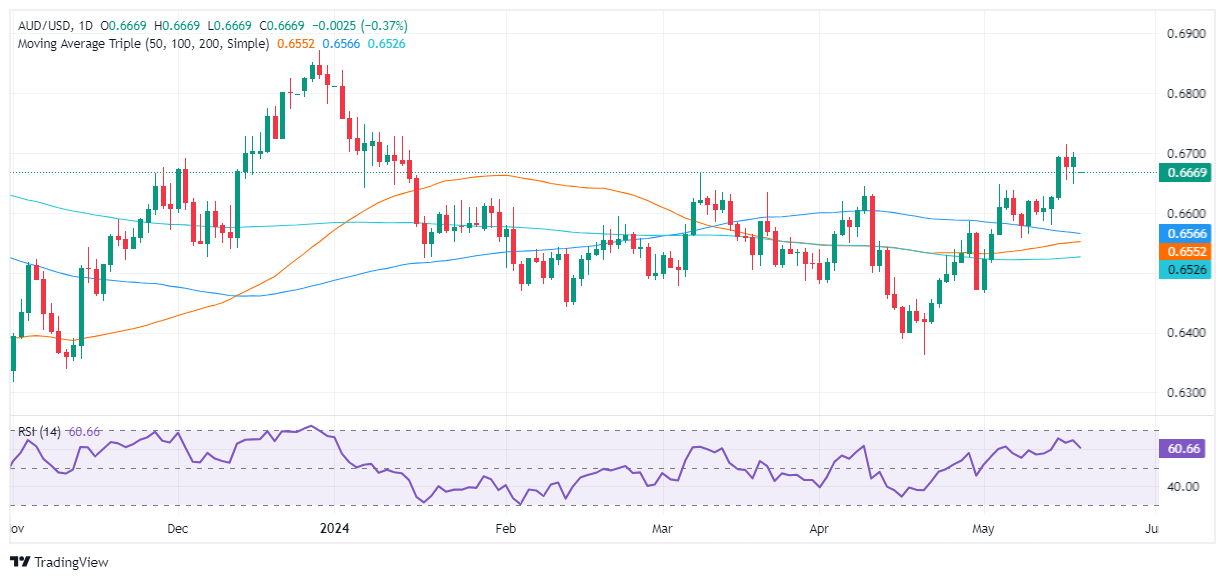
AUD/USD on the backfoot, slides below 0.6700
- Australian Dollar drops 0.37% against the US Dollar, trading at 0.6668.
- US Treasury yields rise, overshadowing upbeat market sentiment and pressuring AUD.
- Focus shifts to RBA meeting minutes and upcoming Fed speakers and minutes release.
The Australian Dollar registered losses of 0.37% against the US Dollar on Monday, amid rising US Treasury yields that underpinned the Greenback. An upbeat market sentiment could not boost the high-beta Aussie Dollar, which tumbled below the 0.6700 figure. As the Tuesday Asian session begins, the AUD/USD trades at 0.6668, virtually unchanged.
AUD/USD dips below 0.6700 as high US Treasury yields bolster the Greenback
Data-wise, the US economy was empty, though several Fed officials crossed the wires. Following April's data, vice-Chair Philip Jefferson stated that it is too early to tell if the inflation slowdown will last. Michael Barr, the Vice-Chair of Supervision, said that restrictive policy needs more time to do its work, while Atlanta’s Fed President Raphael Bostic stated he expects rates to remain steady.
In the meantime, the Australian docket would feature the release of the minutes of the Reserve Bank of Australia (RBA) monetary policy meeting. ANZ analysts wrote, “We suspect the decision to keep rates on hold was not a close one, given the tone of the post-meeting statement.”
On the US front, Tuesday’s economic docket will feature additional Fed speakers ahead of the release of the last meeting minutes on Wednesday.
AUD/USD Price Analysis: Technical outlook
The AUD/USD is neutral to upward bias, but the dip below the March 8 high of 0.6667 could pave the way for a deeper pullback. The next support would be the 0.6600 mark, followed by the 100-day moving average (DMA) at 0.6564 and the 50-DMA at 0.6552. Once surpassed, the next stop would be the 200-DMA at 0.6525.
