NZD/USD Price Analysis: Bulls sustain control, intermittent dips may signal healthy corrections
- The daily RSI and MACD signal a slowdown in positive momentum.
- On the hourly chart, indicators also show that the buyers are losing grip.
- Downward movements which keep the pair above the 100 and 200-day SMAs, should be viewed as healthy corrections.
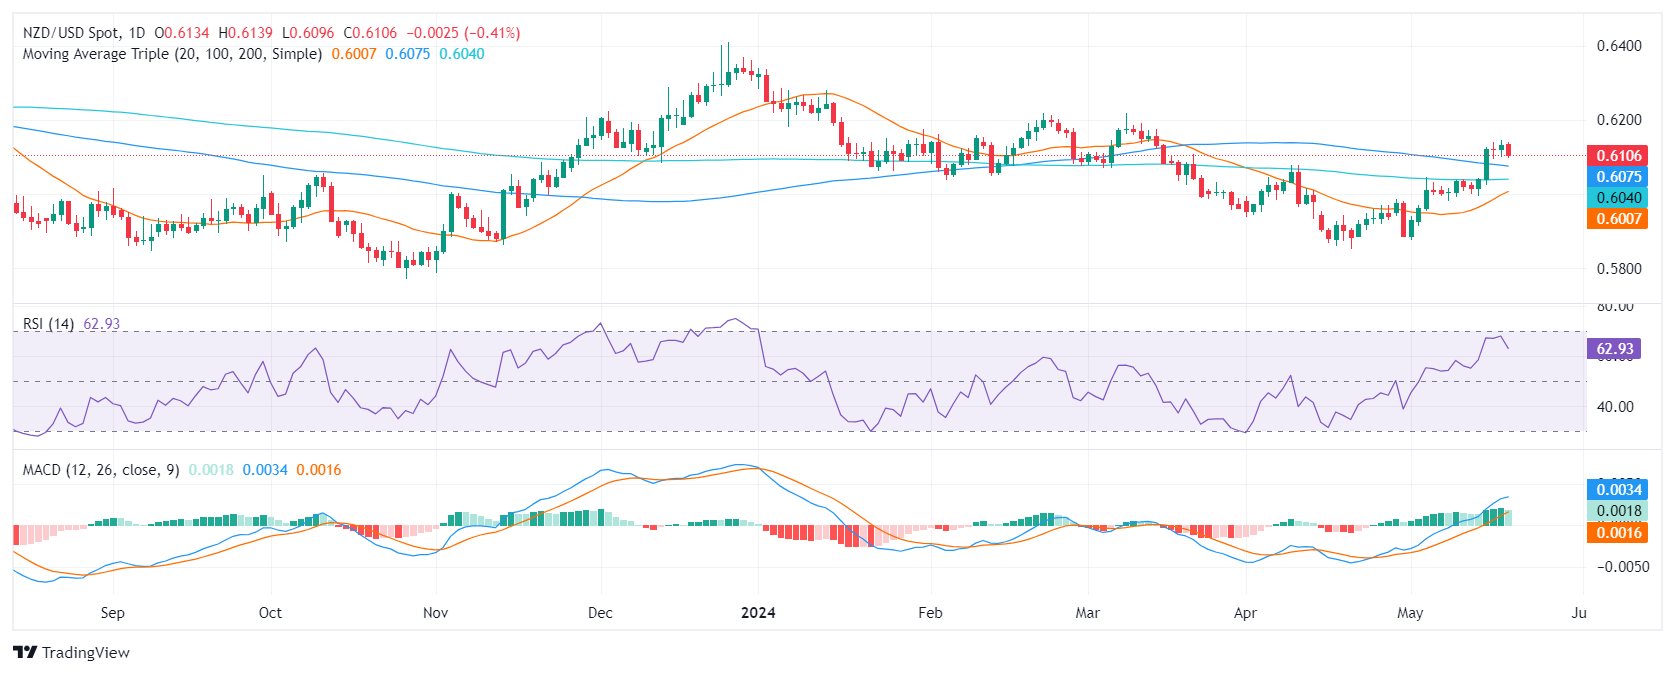
In Monday's session, the NZD/USD stands at 0.6107, revealing a dip of 0.40%. However, the market continues under the dominant control of the bulls. Occasional losses in positive momentum do not indicate a sway of power to the bears and may validate healthy market corrections after a 1.45% weekly gain.
In the daily timeframe, the Relative Strength Index (RSI) is mainly in the positive territory, with a recent reading at 62. This implies a moderate bullish momentum. Nevertheless, the tapering down of the index from its peak nearing overbought conditions may suggest a slowdown in the upward thrust. The Moving Average Convergence Divergence (MACD) complements this, revealing decreasing green bars indicative of a shrinking positive momentum.
NZD/USD daily chart

Contrarily, an examination of the hourly chart reveals a negative territory dominance for the RSI. The recent value stands at 39, revealing the presence of more sellers in the last session. The MACD for the same period manifests flat red bars, subsequently confirming the negative momentum.
NZD/USD hourly chart

Deep diving into the broader landscape, the NZD/USD is appealing due to its position above the 20, 100, and 200-day Simple Moving Averages (SMAs). Such positioning confirms a positive bias for the pair, forecasting stable reliability for short-term and long-term investors.
The current scenario, where investors are taking profits while holding above the recently conquered 100 and 200-day SMAs, indicates that any downward movement should not be considered as a selling signal. Instead, it can be viewed as a healthy correction within the overall bullish context. Therefore, despite short-term volatility, the long-term prospects remain in favor of the bulls.