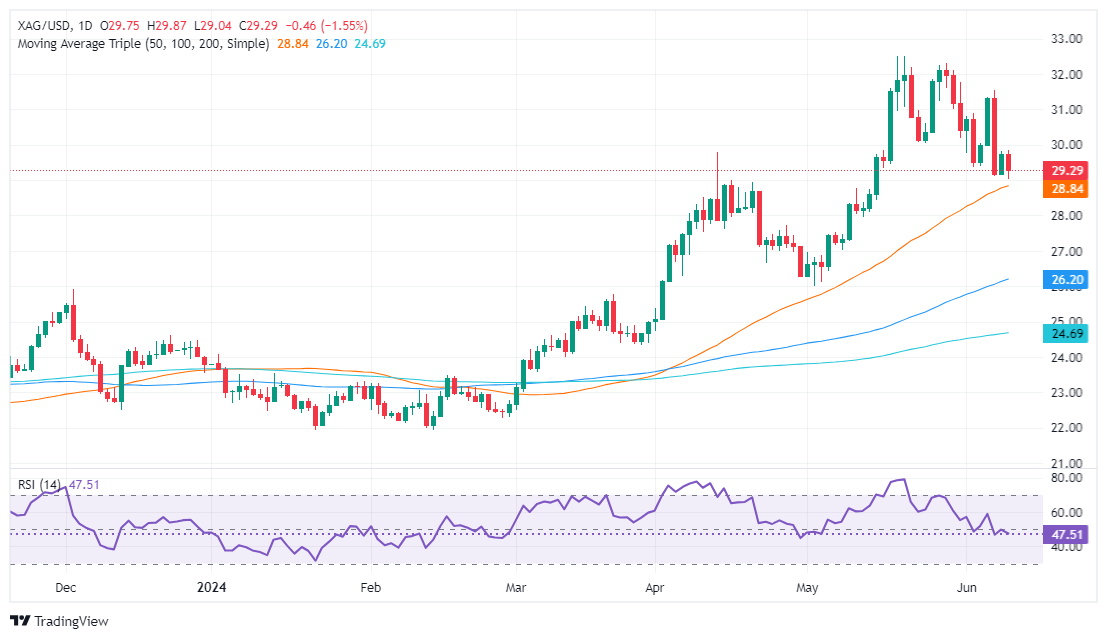
Silver Price Analysis: XAG/USD drop as double-top chart pattern remains intact
- Silver prices drop 1.65% as the US Dollar gains 0.15%.
- Double-top chart pattern indicates potential further decline, with key supports at $29.00 and below.
- US inflation data and FOMC decision on Wednesday poised to impact silver prices and the broader market.
Silver prices retreated on Tuesday and fell 1.65% as the Greenback remained in the driver’s seat and posted gains of 0.15%, ahead of crucial data to be revealed on Wednesday. US inflation figures and the FOMC’s monetary policy decision would dictate the US Dollar's faith. The XAG/USD trades at $29.27 and gains some 0.12% as Wednesday’s Asian session begins.
XAG/USD Price Analysis: Technical outlook
Silver's double-top chart pattern remains in play, hinting that spot prices of the grey metal will decline further. XAG/USD fell below the May 24 low of $30.05, confirming the double-top pattern.
The initial support for XAG/USD remains at $29.00, followed by the June 7 low of $29.12. Breaking below this level could lead to a drop under $29.00, then to the May 18, 2021, high turned support of $28.74, and subsequently to the June 10, 2021, high of $28.34. The final target is the double top objective at $27.80.
On the other hand, if XAG/USD moves upwards and closes above $29.00, it could challenge the May 24 low, which has turned into resistance at $30.05. Buyers are currently struggling to reclaim $30.00, which suggests potential for further downside.
XAG/USD Price Action – Daily Chart
