AUD/JPY Price Analysis: Bulls Make Stride, consolidation still prevailing
- In Tuesday's session, the pair approached the 20-day SMA, and got rejected.
- The pair is still in consolidation mode and may not have enough momentum to continue rising.
- The 102.00-104.00 range becomes an anticipated movement area for the upcoming sessions.
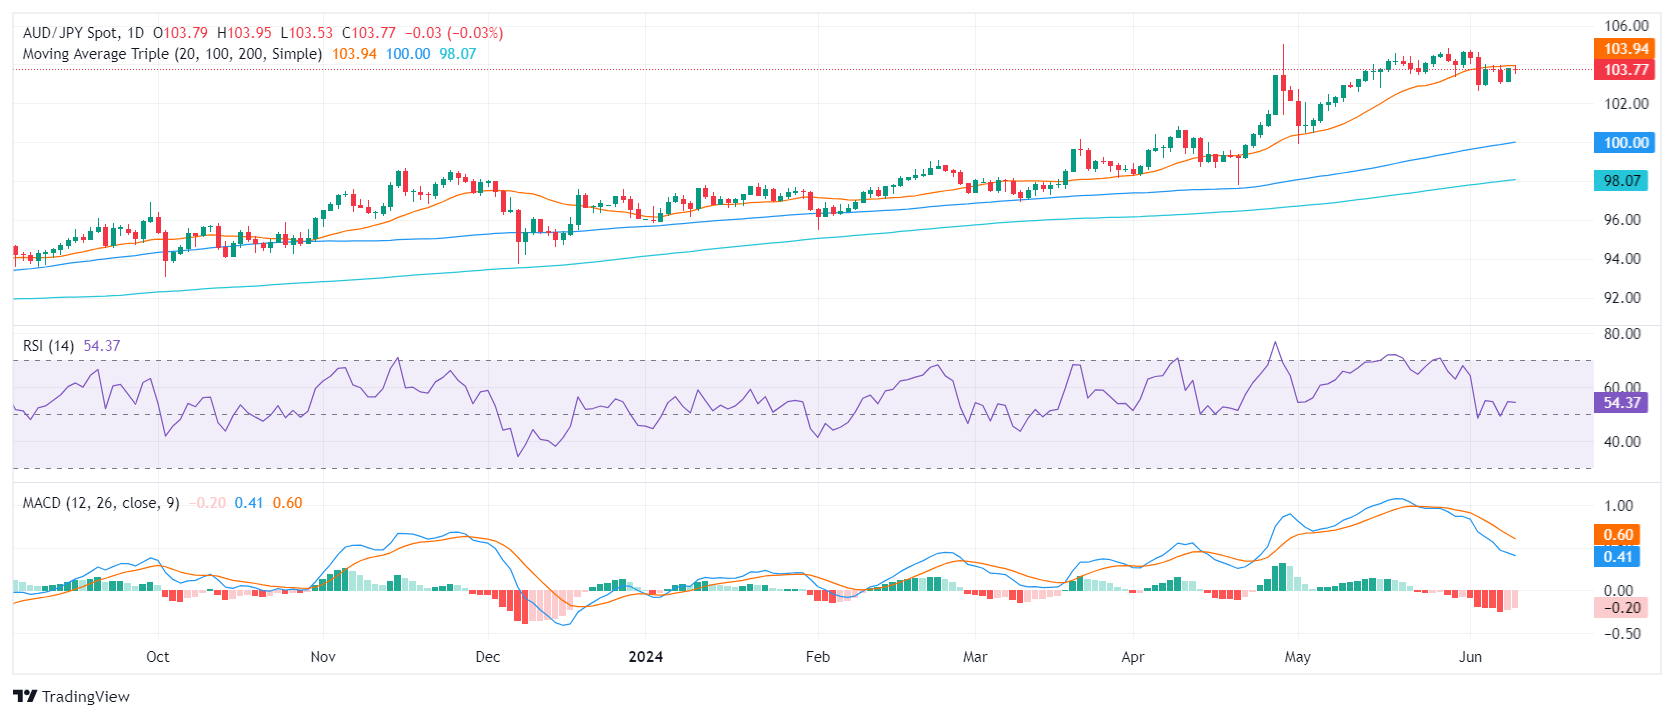
In Tuesday’s sessions, the AUD/JPY pair has been making strides to improve the short-term outlook, nearing the 20-day Simple Moving Average (SMA) at 103.90. However, with the pair still in consolidation mode, there might not be enough momentum for further rise. In line with that, buyers failed to hold daily gains.
The daily Relative Strength Index (RSI) for the AUD/JPY currently stands at 53, displaying a slight but positive momentum. Furthermore, the Moving Average Convergence Divergence (MACD) continues to print decreasing red bars, hinting towards a certain weakness in the bearish momentum.
AUD/JPY daily chart

In conclusion, the AUD/JPY pair seems to be in consolidation mode as it struggles to rise above the 20-day SMA. The range between 102.00 and 104.00 may signal future trading movements unless bulls can regain control above the 20-day SMA, pushing towards the 105.00 resistance level. On the positive side for the buyers, there are some signs of a slight deceleration in the bearish activities.