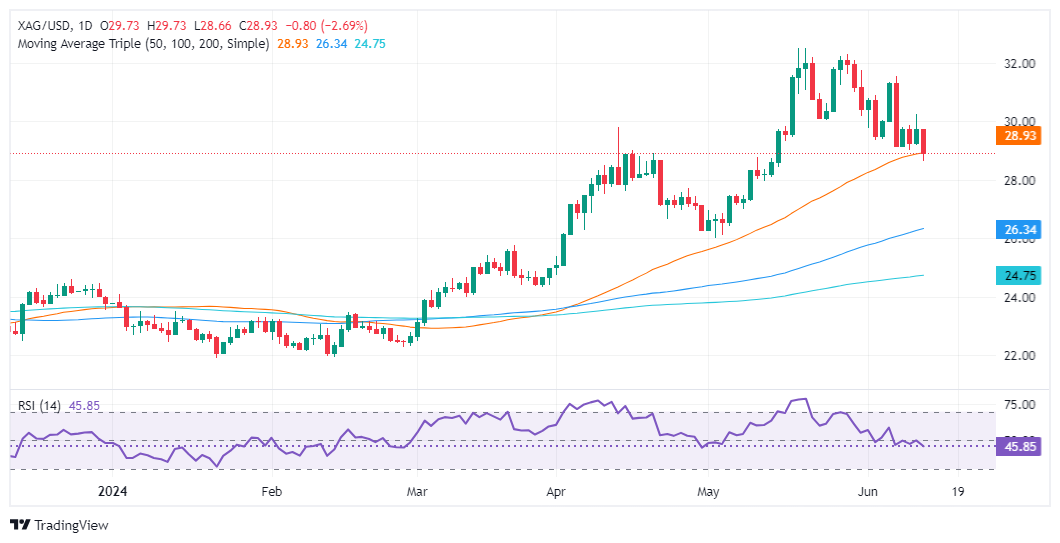
Silver Price Analysis: XAG/USD slumps below $29.00 as bears eye 50-DMA
- Silver prices have fallen aggressively during the last six days, with losses of more than 7%.
- Momentum supports further downside as RSI turned bearish.
- Key support levels are seen at $28.74, followed by $26.40 and $26.02.
Silver prices registered losses of more than 2.40% on Thursday after the Federal Reserve held rates unchanged and hinted that they would likely cut once instead of the three foreseen in the March Summary of Economic Projections (SEP). At the time of writing, the XAG/USD trades at $28.95.
XAG/USD Price Analysis: Technical outlook
From a price action standpoint, the XAG/USD is neutral to upward biased. The downtrend is capped by the presence of the 50-day moving average (DMA) at around $28.74, which is seen as the first support level. The grey metal bounced from around three-week lows of $28.66 to current spot prices.
Momentum remains bearish, as the Relative Strength Index (RSI) depicts. Hence, if XAG/USD achieves a daily close below the 50-DMA, the Silver price could plunge to the next support level seen at the 100-DMA at $26.40, ahead of the May 2 low of $26.02.
On the other hand, if Silver buyers conquer $29.00, they must clear the $30.00 handle, if they would like to re-test the year-to-date (YTD) high of $32.51.
XAG/USD Price Action – Daily Chart
