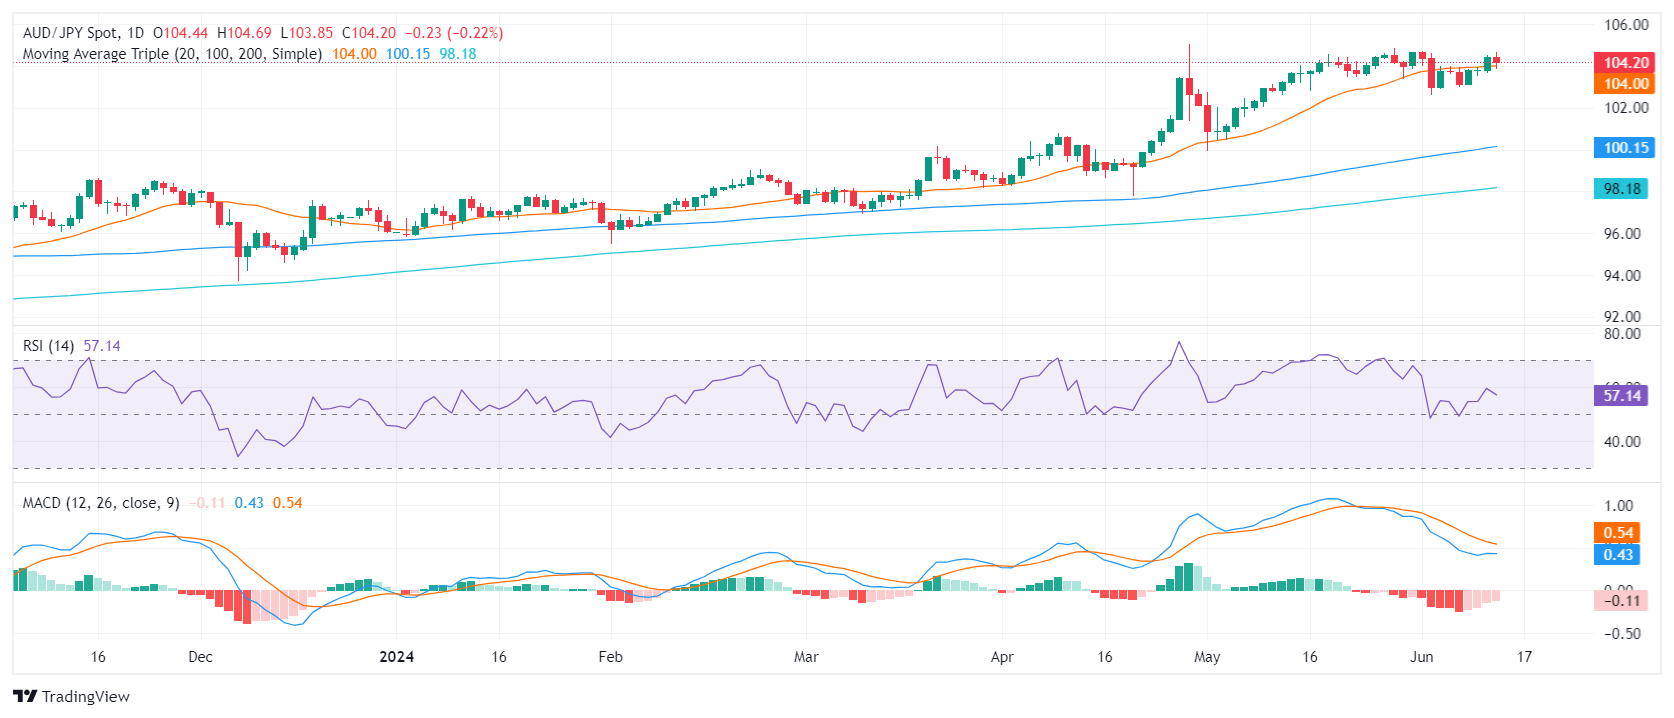
AUD/JPY Price Analysis: Bulls take a breather, sellers test the 20-day SMA support
- The AUD/JPY pair is experiencing a decline as buyers take profits, causing it to hover around the 20-day SMA.
- In spite of the drop, the pair remains in consolidation, suggesting the possibility of a limited decline for the time being.
- If the bulls are successful in building support around the 20-day SMA, the next potential target lies within the 104.50-105.00 price range.
In Thursday's session, the AUD/JPY pair witnessed a dip towards 104.00 as buyers cashed in their profits, which saw the pair soaring above the 20-day Simple Moving Average (SMA). The 20-day SMA, which previously acted as a point of resistance, seems to be the new focus point for building support in order to lessen further losses. Nevertheless, the persistent consolidation phase suggests a lack of momentum for a steady rise.
The daily Relative Strength Index (RSI) of the AUDJPY now stands at 54, a decrease from the previous session's score of 57, indicating a slight downward trend and implying that the previous upward momentum may be losing steam. In contrast, the Moving Average Convergence Divergence (MACD) is exhibiting stationary red bars, indicative of a stabilizing momentum.
AUD/JPY daily chart
 In conclusion, the AUD/JPY pair appears to be in a consolidation phase, despite a drop this Thursday as trading hovers around the 20-day SMA. The possible range of 102.00-103.00 for the upcoming sessions may denote the continuation of side-ways trading as bulls seem to be consolidating from the May rally which had lifted the pair near 105.00. Nonetheless, the reduction in selling momentum could represent a gearing up by the bulls for the next upward swing, potentially retesting the 104.50-105.00 area.