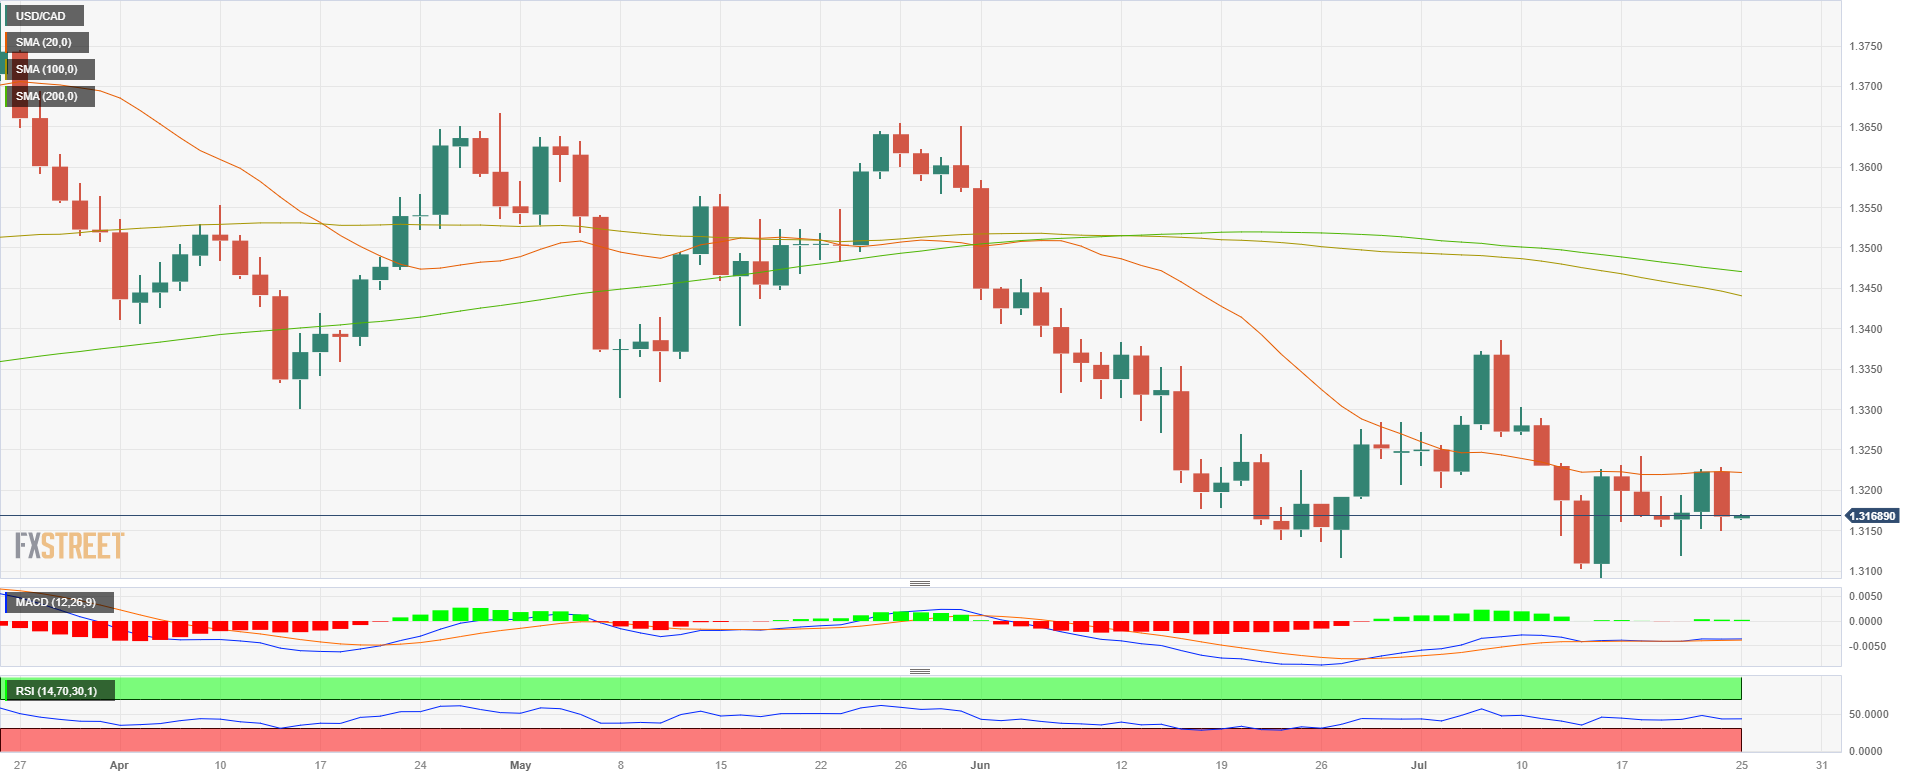
USD/CAD Price Analysis: CAD strengthened on the back of rising Oil prices
- USD/CAD fell towards 1.3170 as the bulls failed to reconquer the 20-day SMA.
- Global supply concerns are boosting Oil prices, favouring the CAD.
- The USD continued to recover following mixed PMIs.
On Monday, the USD/CAD declined towards 1.3170 despite the USD trading strong against most of its rivals. In that sense, the CAD managed to gain traction on the back of rising Oil prices as Canada is a producer. The focus now shifts to Wednesday's Federal Reserve (Fed) decision.
On the data front, S&P Global released mixed data on the US economy. July's Manufacturing PMI came in positive at 49, surpassing the expected 46.4 and the previous 46.3. On the other hand, July's Services PMI reported 52.4, falling short of the higher consensus of 54 but still lower than the last 54.4. Reacting to the data, the USD DXY traded with gains near the 101.40 area.
Regarding Wednesday’s Fed decision, markets have already priced in a 25 basis point (bps) hike, but the odds of a hike past July fell to near 20%, according to the CME FedWatch tool. In that sense, the Federal Open Market Committee's (FOMC) monetary policy statement and Chair Powell’s words will be closely watched as investors look for clues regarding forward guidance.
In favour of the CAD, the decrease in operating oil rigs contributes to supply-side concerns and drives crude oil prices higher. Additionally, the expectations of economic stimulus in China (the world's biggest Oil importer) support the black gold price, as the Chinese government has expressed its commitment to stimulate domestic demand and support the property sector.
USD/CAD Levels to watch
The daily chart suggests a bearish outlook for the short-term USD/CAD. Bulls were rejected several times by the 20-day Simple Moving Average (SMA), signalling that the buyers struggle to gain momentum. In addition, technical indicators show weakness, with the Relative Strength Index (RSI) below 50.00 and the Moving Average Convergence Divergence (MACD) printing fading green bars.
Resistance Levels: 1.3222 (20-day SMA), 1.3240, 1.3250.
Supports Levels: 1.3150, 1.3120, 1.3110.
USD/CAD Daily chart
