Silver Price Analysis: XAG/USD prints a leg-up despite remaining bearish
- Silver trades slightly up by 0.16% due to the soft US Dollar.
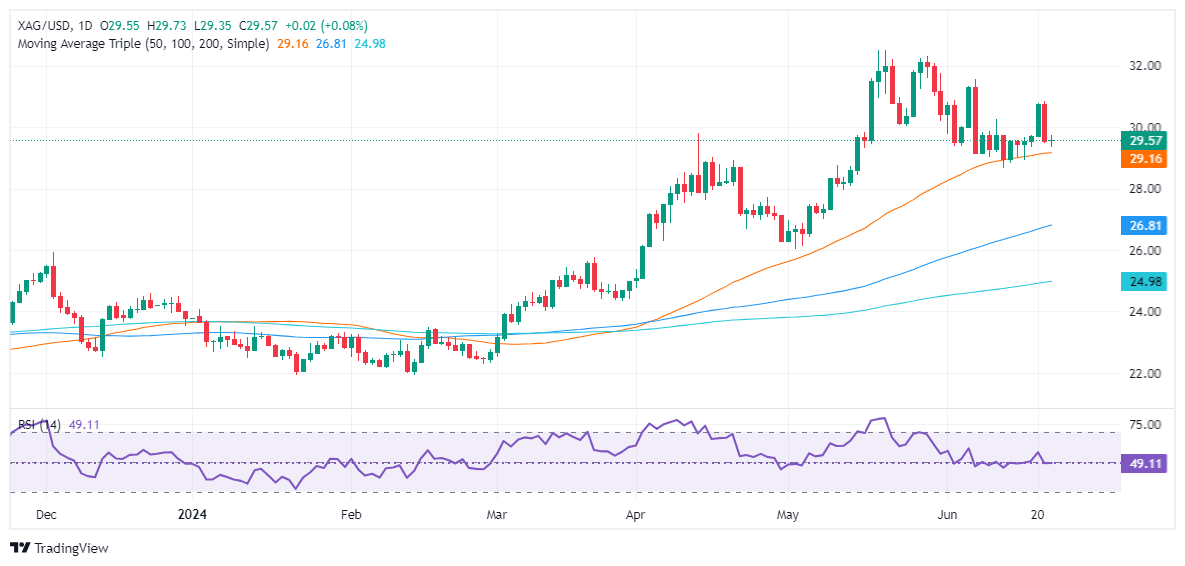
- Technical outlook shows a bearish engulfing pattern from last week, with RSI indicating bearish momentum.
- Key support levels: 50-DMA at $29.14, $29.00, MTD low at $28.66, and 100-DMA at $26.82.
- Key resistance levels: June 7 high at $31.54, $32.00, and YTD high at $32.51.
Silver prices remain flat on Monday amid firm US Treasury yields and a weaker US Dollar. The XAG/USD trades at $29.58, up a minimal 0.16%.
XAG/USD Price Analysis: Technical outlook
Last week, the grey metal formed a ‘bearish engulfing’ chart pattern, which opened the door for further downside. Momentum shifted in the seller's favor as the Relative Strength Index (RSI) turned bearish, opening the door for further losses.
Given the backdrop, the XAG/USD's first support would be the 50-day moving average (DMA) at $29.14; it will expose $29.00. Breaching this level could lead to the MTD low of $28.66, ahead of a potential drop towards the 100-DMA at $26.82.
On the flip side, if XAG/USD resumes its uptrend, the next resistance level is the June 7 high of $31.54. Clearing this level would target $32.00 before challenging the year-to-date (YTD) high of $32.51.
XAG/USD Price Action – Daily Chart
