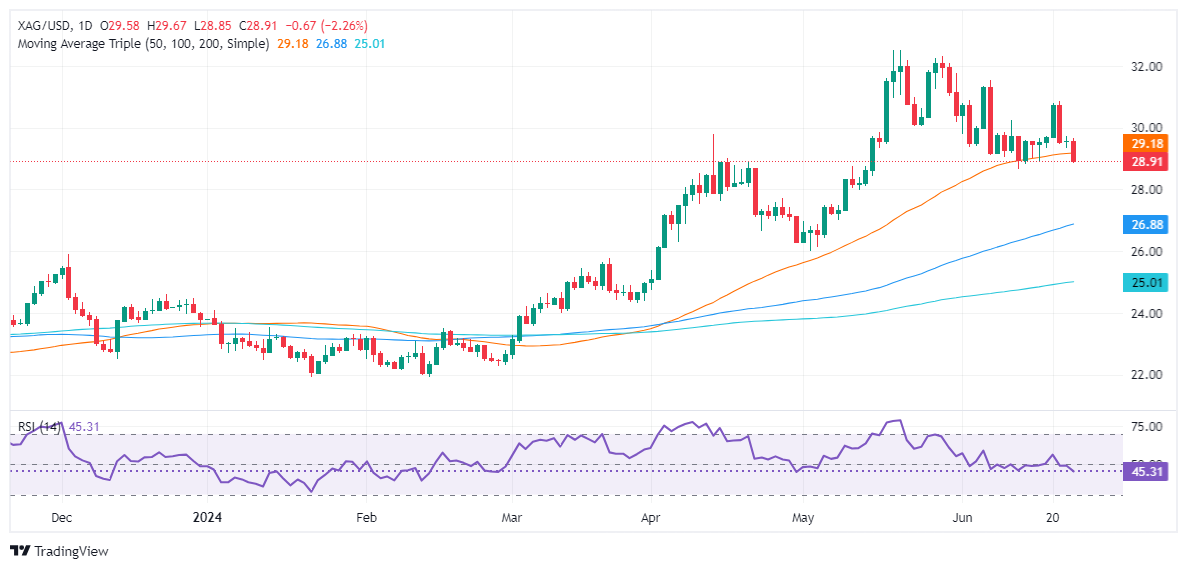
Silver Price Analysis: XAG/USD collapses below 50-DMA as surrenders $29.00
- Silver drops to $28.90, under 50-day MA, after Fed's Bowman's hawkish remarks.
- Bearish pattern evident, with RSI suggesting further downside.
- Support levels: $28.74 (May 18 high), $28.28 (June 10 high), $28.00, $26.82 (100-DMA).
- Resistance points: $29.16 (50-DMA), $31.54 (June 7 high), $32.00, $32.51 (YTD high).
Silver price collapsed on Tuesday amid a strong US Dollar, sponsored by hawkish comments by Fed Governor Michelle Bowman. Although US Treasury yields were unchanged, the Greenback registered moderate gains, which weighed on the grey metal. The XAG/USD trades at $28.90, below its 50-day moving average (DMA) for the first time since March 1.
XAG/USD Price Analysis: Technical outlook
The grey metal formed a ‘bearish engulfing’ chart pattern last week, which opened the door for further downside. Momentum favors sellers, as shown by the Relative Strength Index (RSI), which stands bearish. This suggests that Silver could extend its losses.
Hence, the XAG/USD's first support would be the May 18, 2021, high turned support at $28.74, ahead of challenging June 10, 2021, high at $28.28. Key support levels lie underneath, like the $28.00 figure, followed by the 100-DMA at $26.82.
Conversely, if XAG/USD resumes its uptrend, the next resistance level would be the 50-day moving average (DMA) at $29.16. Once surpassed, the next stop is the June 7 high of $31.54. Clearing this level would target $32.00 before challenging the year-to-date (YTD) high of $32.51.
XAG/USD Price Action – Daily Chart
