NZD/USD Price Analysis: Kiwi struggles, eyes on SMA convergence support
- In Tuesday's session, NZD/USD marginally rose, while bears tested the 100 and 200-day Simple SMA convergence at 0.6070.
- Buyers saw some resilience but the dominant force seems to be the selling one.
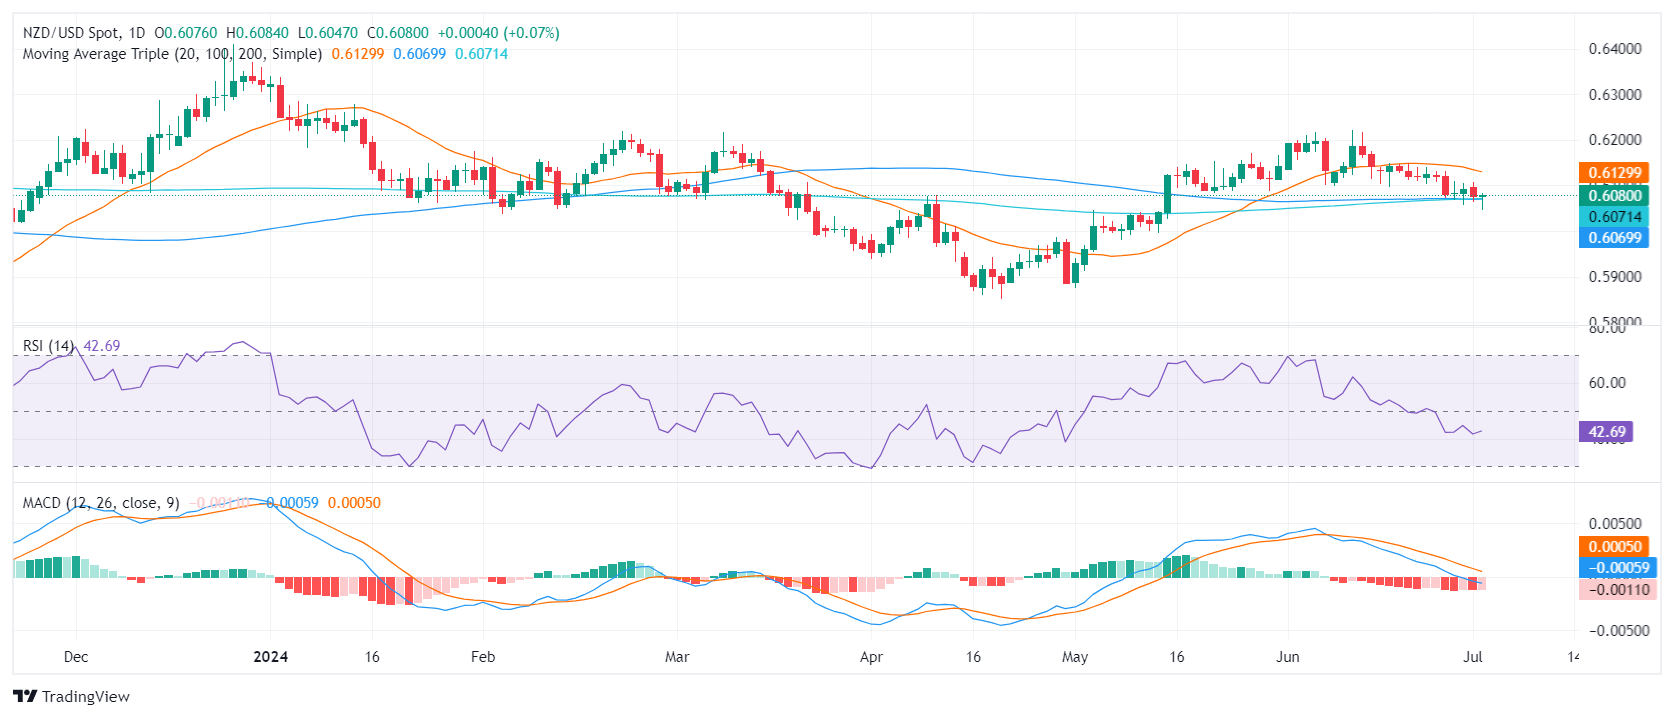
On Tuesday, the NZD/USD saw minimal gains, with the pair now testing the crucial convergence of the 100 and 200-day Simple Moving Averages (SMAs) near the 0.6070 level and cleared daily losses. Whether the bulls gather momentum or the bears conquer this zone could provide fresh momentum and chart the pair's future course.
The Relative Strength Index (RSI) for the NZD/USD pair on the daily chart sits below 50, indicating a selling strength. While the RSI is gaining gradually, the broader negative momentum cannot be ignored. Similarly, the Moving Average Convergence Divergence (MACD) continues to print flat red bars, signaling the subdued but bearish market bias.
NZD/USD daily chart

The NZD/USD encounters immediate support near the 0.6070 threshold, coinciding with the meeting point of the 100 and 200-day SMAs. If the bears break below it, more selling pressure could mount, confirming a deeper downswing. More support can be found near the 0.6050 level and below at 0.6030. The good news is that bears pushed the pair towards 0.6050 but bulls managed to recover and bring it back to 0.6070.
Conversely, resistance now lies around 0.6100 followed by a crucial hurdle at the 20-day SMA at 0.6150. Additional resistance points expected are at 0.6170 and 0.6200. A break above these resistance levels could potentially end the bearish grip and steer the pair into a bullish zone.