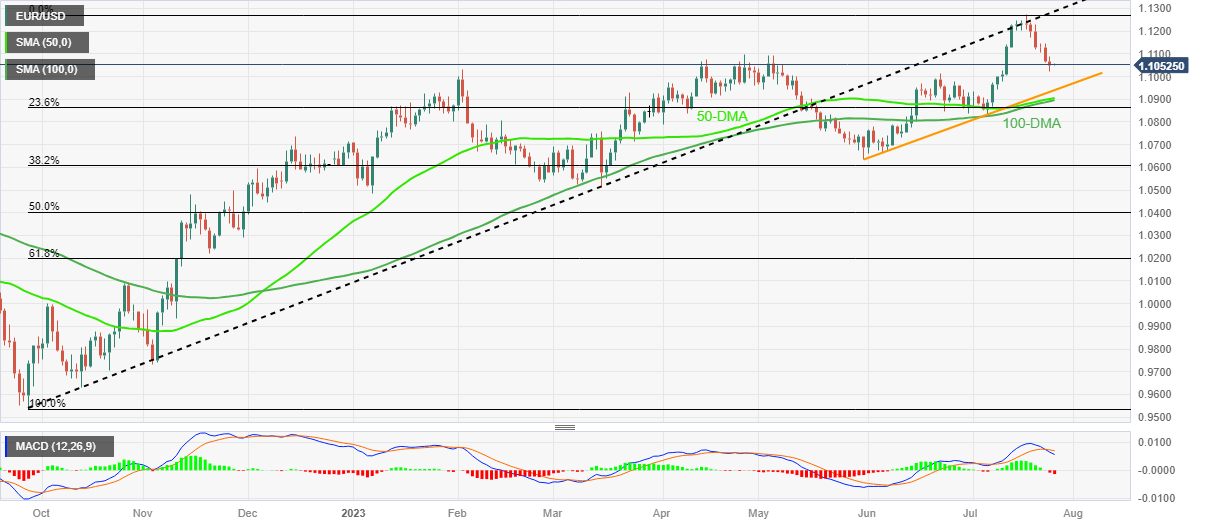
EUR/USD Price Analysis: Euro bears flirt with multiple supports around mid-1.1000s on Fed day
- EUR/USD fails to cheer US Dollar’s retreat as it stays pressured around two-week low after six-day downtrend.
- Downbeat EU data, U-turn from previous support line and bearish MACD signals keep Euro sellers hopeful.
- Multiple levels marked in April-May period test Euro bears ahead of the 1.1000 psychological magnet.
- Two-month-old rising support line, key DMA confluence appear important to watch during further downside.
EUR/USD holds lower grounds near 1.1050 amid early Wednesday morning in Asia, fading the bounce off a two-week low marked late Tuesday, as markets await the all-important Federal Open Market Committee (FOMC) monetary policy meeting announcements.
That said, the Euro pair dropped in the last six consecutive days despite the previous day’s US Dollar retreat as downbeat statistics from the bloc renew recession fears and prod the European Central Bank (ECB) hawks ahead of Thursday’s ECB Interest Rate Decision.
Also read: EUR/USD slumps amid EU’s recessionary fears ahead of Fed and ECB’s decisions
Technically, a clear U-turn from the 10-month-old previous support line, now resistance around 1.1290, joins the bearish MACD signals to keep the EUR/USD sellers hopeful.
However, a slew of levels marked during April and May, around the mid 1.1000s precede the monthly tops registered in February and June, respectively near 1.1030 and 1.1010, to challenge the Euro bears of late.
Following that, a two-month-old rising support line and a convergence of the 50-DMA and 100-DMA, close to 1.0940 and 1.0900 in that order, will be crucial to watch for the EUR/USD sellers.
On the flip side, a daily closing beyond April’s peak of near 1.1100 becomes necessary for the EUR/USD bulls to retake control.
Even so, the 1.1150 and the 1.1200 round figures may prod the Euro buyers before directing them to the support-turned-resistance line of around 1.1290.
EUR/USD: Daily chart

Trend: Limited downside expected