Gold Price Forecast: XAU/USD sees green amid Fed decision anxiety
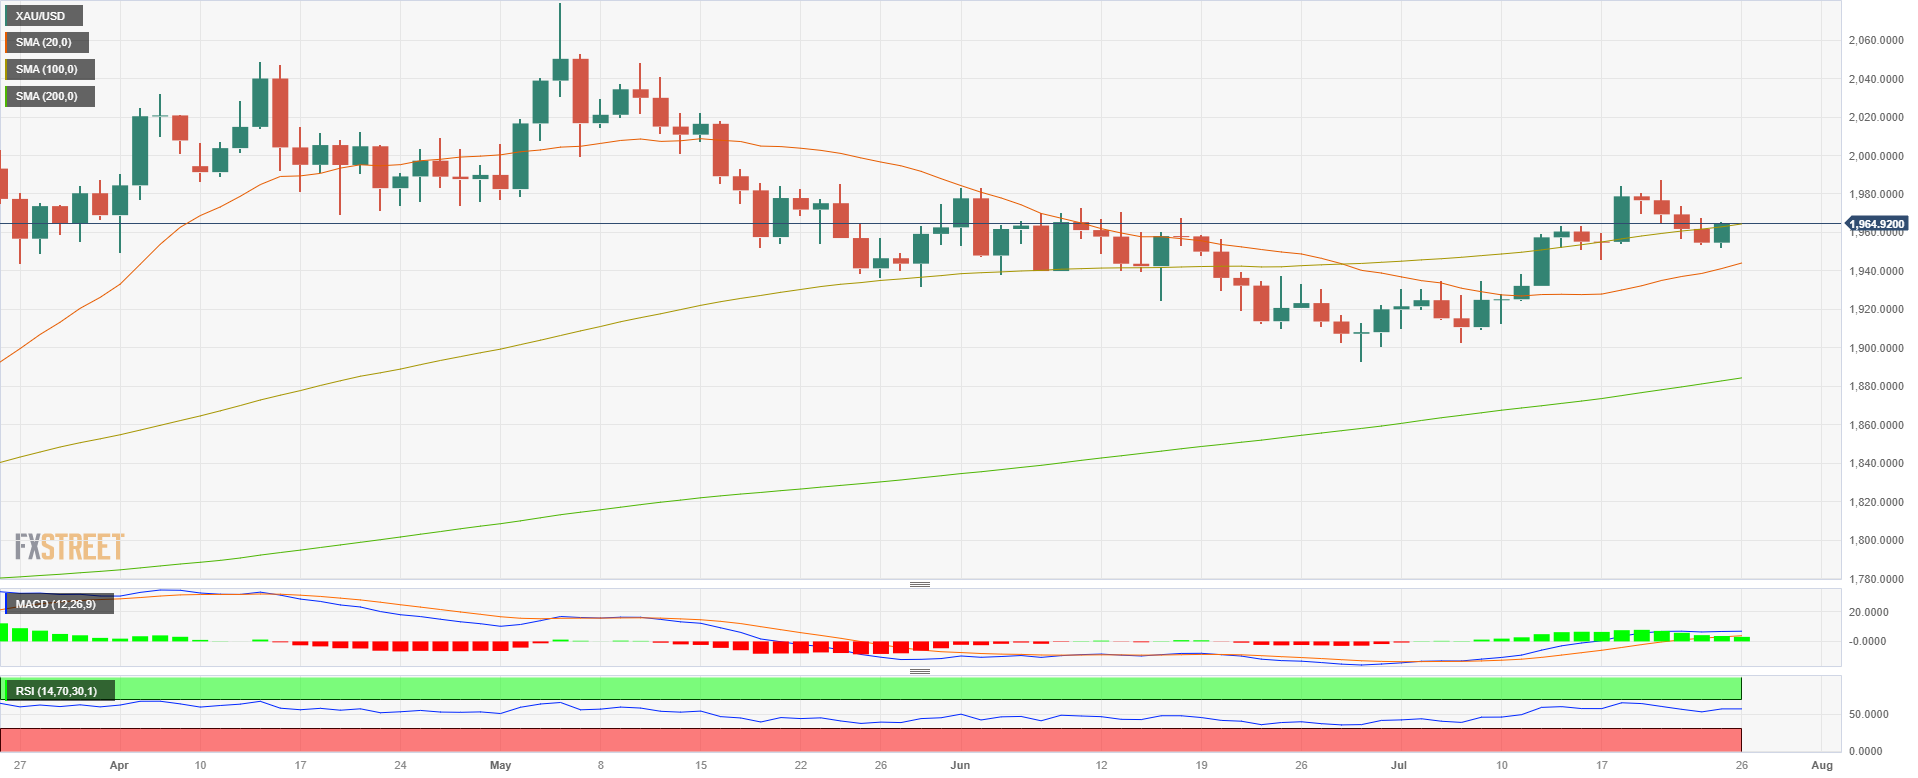
- XAU/USD rebounds from 4 consecutive days of losses and jumped above the 100-day SMA.
- Uncertainty ahead of the FOMC press conference and the Fed's monetary policy statement boosted gold prices.
- The US reported solid Housing and Manufacturing sector data.
After a lacklustre start to the week for the XAU/USD, it traded with gains in Tuesday's session, jumping above $1,960 with 0.50% gains. Ahead of the Federal Reserve (Fed) decision on Wednesday, the American yields are trading mixed, with the 2-year rate showing a 1% decline but the 10-year slightly rising to 3.88%.
On the data front, the Housing Price Index from the Federal Housing Agency and S&P/Case-Shiller Home Price Indices (YoY) for May came in higher than expected at 0.7% and -1.7%, respectively. The Richmond Fed Manufacturing Index from July came in at -9, slightly better than the expected -10.
That being said, tightening expectations by the Fed remain unchanged. According to the CME FedWatch tool, markets have priced in a 25 basis point (bps) hike on Wednesday but aren’t sure about the next steps after July. In that sense, the messaging from the monetary policy statement and Jerome Powell’s stance will set the pace of the bond markets fuelling volatility on the non-yielding metals.
XAU/USD Levels to watch
If the buyers consolidate above the 100-day Simple Moving Average (SMA), the technical outlook for the XAU/USD will be bright. The Relative Strength Index (RSI) stands in positive territory, pointing north, while the Moving Average Convergence Divergence (MACD) prints green bars suggesting that the bulls are gaining strength.
Resistance levels: $1,970, $1,980, $1,990.
Support levels: $1,965 (100-day SMA), $1,940, $1,900.
XAU/USD Daily chart
