NZD/JPY Price Analysis: Cross extends losing streak, indicators near oversold decline
- Tuesday's session saw additional losses in the NZD/JPY.
- The cross extended its four-day losing streak to five being 2.50% lower compared to last week.
- The pair might consolidate as indicators approach the oversold terrain.
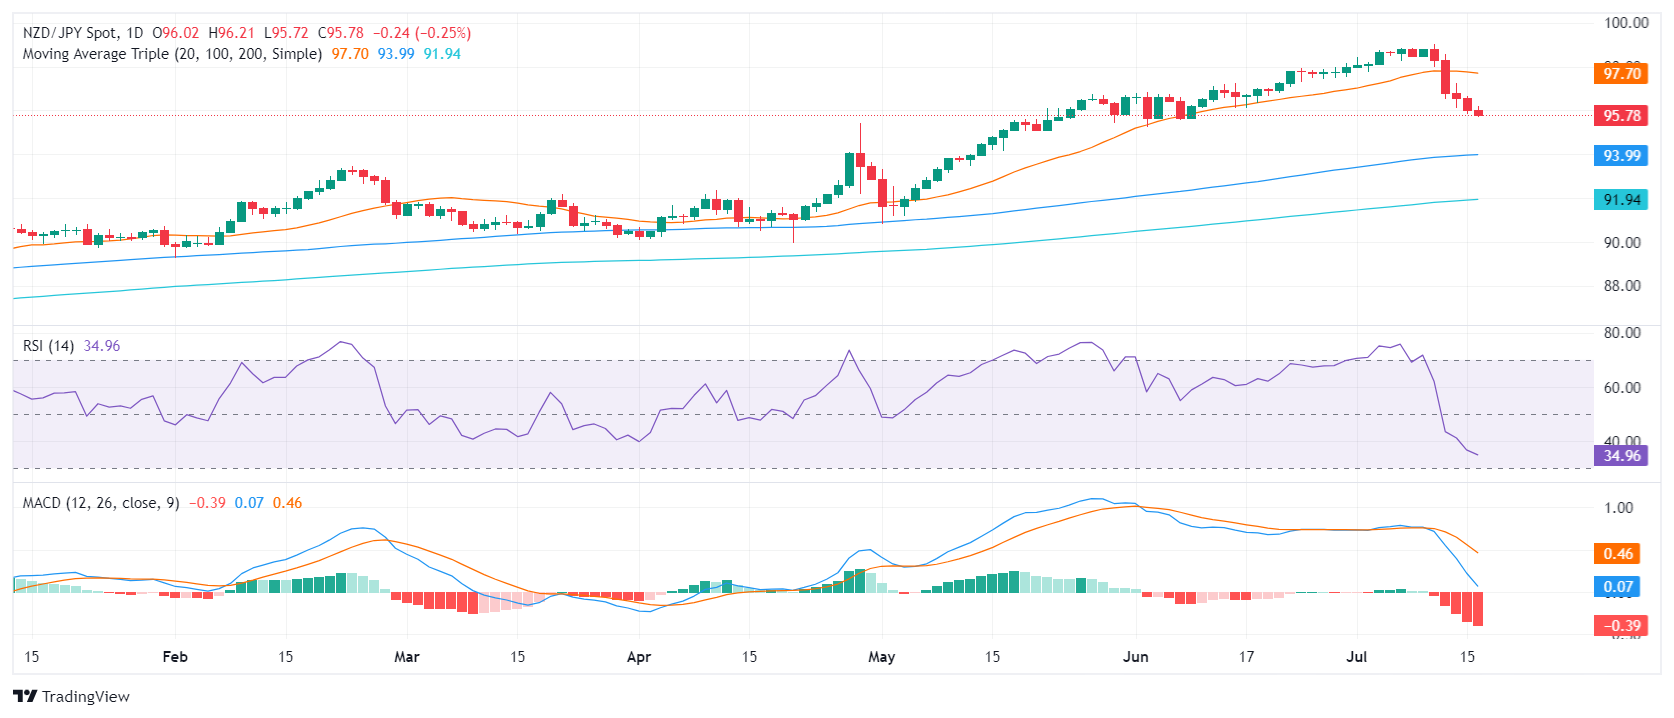
On Tuesday, the NZD/JPY saw more losses and fell below 96.00. The cross extended its bearish streak to five and is now down by more than 2.50% since last week.
The daily technical indicators still remain under the bear's control. The Relative Strength Index (RSI), currently at 35, marginally moved downwards, keeping the bearish bias intact. In line with this, the Moving Average Convergence Divergence (MACD) continues to print flat red bars that suggest persistent selling activity. However, the RSI near 30, suggests that a correction looms.
NZD/JPY daily chart

Reflecting the prevailing bearish tone, immediate support levels are identified at 95.50 and the key level at 95.50 and 95.30. A fall below these levels, particularly the strong support at 95.50, could serve as a confirmation of the bear's domination in the short term. On the flip side, the resistance levels can now be spotted at the previous support breakpoints of 97.00, the 20-day Simple Moving Average (SMA) residing at 97.70, and the vital level of 98.00.