NZD/USD Price Analysis: Pair stuck in 0.6050-0.6070 range, bears in control
- NZD/USD finds difficulty in establishing above the 0.6070 level, hovering close to lows outlined in May.
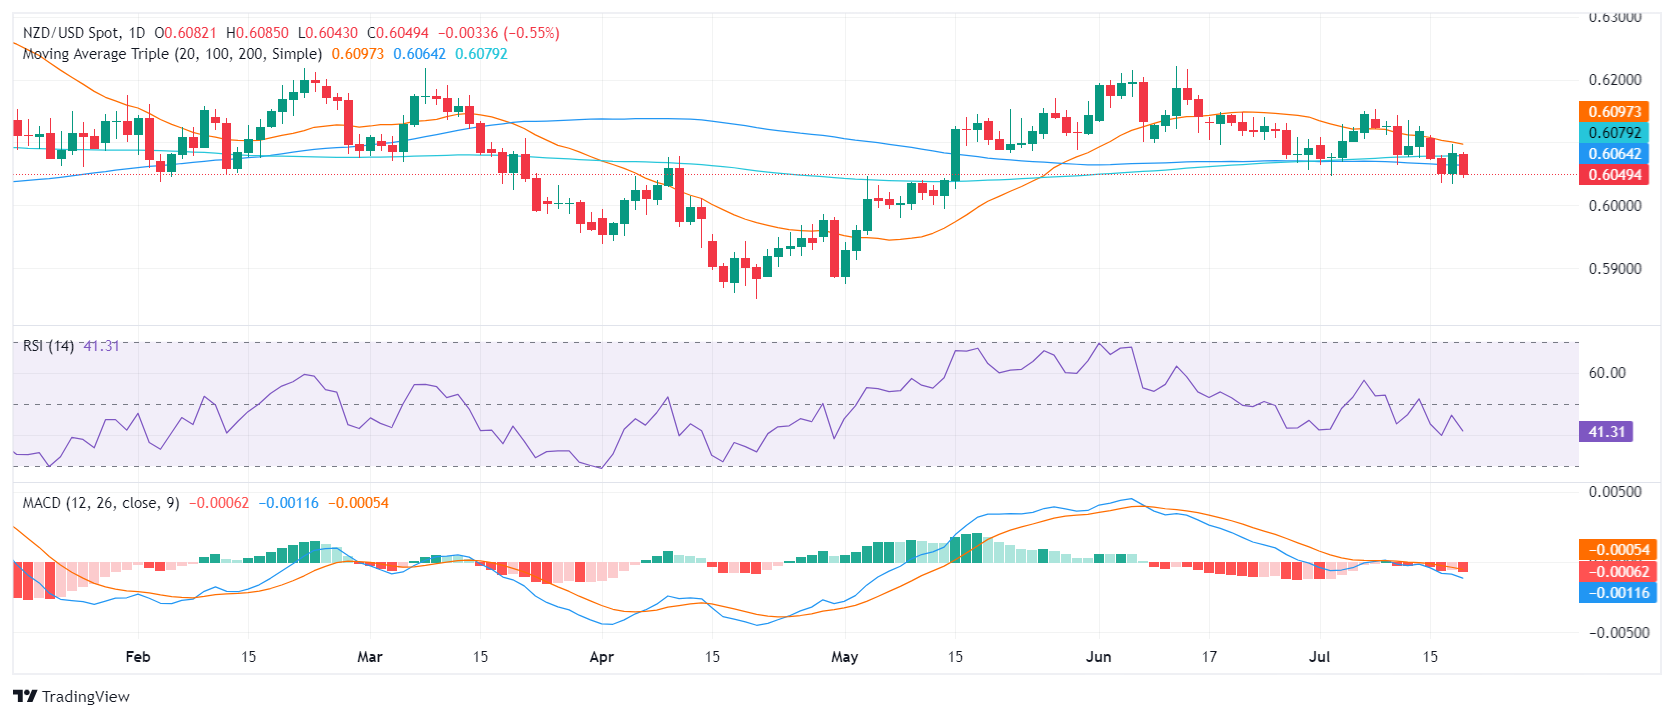
- The pair continues to trade beneath the pivotal 20, 100, and 200-day SMA lines, pointing to a neutral to bearish outlook.
- Daily indicators maintain a bearish tilt as selling pressure persists.
During Thursday's session, the NZD/USD dropped by 0.60% to touch the 0.6050 level. The pair's struggle to remain firm above the 0.6070 mark keeps it near the lows recorded in May. Significantly, NZD/USD is still trading under the important Simple Moving Averages (SMA) of 20, 100, and 200 days, inferring a neutral to bearish perspective.
The daily technical indicators affirm the bearish stance. The Relative Strength Index (RSI) sits at 39, moving downward compared to the Wednesday session's reading of 45. Meanwhile, the Moving Average Convergence Divergence (MACD) continues to show rising red bars, indicating an escalating bearish momentum.
NZD/USD daily chart

Resistance is now situated at the earlier support level of 0.6070, succeeded by the 20-day SMA around the 0.6100 level, then at 0.6150 and further above at 0.6200. Bulls require a decisive closing above these points to indicate a bullish reversal, shifting the focus upward.
The downside observes robust support at 0.6050, followed by 0.6030, adjusting to the bearish tilt, a significant benchmark at 0.6000 comes into sight. An appreciable plunge beneath these levels would certify the bearish outlook, potentially leading to a correction toward lower levels.