USD/JPY Price Analysis: Recovers and hovers around 154.00
- USD/JPY finishes unchanged, recovering from daily low of 151.94.
- Technical outlook indicates bearish bias with RSI nearing oversold levels.
- Key levels: bearish continuation below 153.00, support at 151.94, bullish control above 156.00.
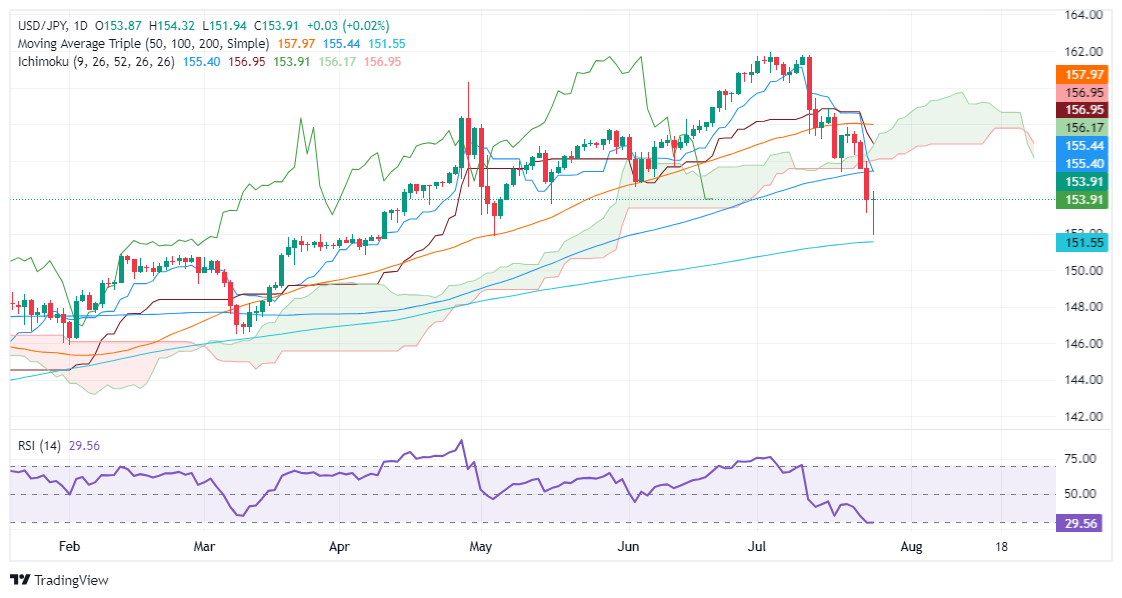
The USD/JPY trimmed some of its earlier losses and finished Thursday’s session virtually unchanged, trading at 153.93 after hitting a daily low of 151.94. The release of better-than-expected US GDP figures for the second quarter of 2024 sponsored the Greenback’s recovery versus the Japanese Yen.
USD/JPY Price Analysis: Technical outlook
The USD/JPY remained bearishly biased once it decisively breached the Ichimoku Cloud (Kumo), which exacerbated the pair’s drop to lower prices. Sellers are gathering momentum, as shown by the Relative Strength Index (RSI), which turned bearish and stands near the oversold level.
For a bearish continuation, sellers must push the USD/JPY pair below the 153.00 figure. Once done, the next support would be the July 25 low of 151.94, followed by the 151.00 mark.
Conversely, if USD/JPY buyers want to regain control, they must reclaim the 156.00 figure so that they can lift prices above the Kumo.
USD/JPY Price Action – Daily Chart

Japanese Yen PRICE This week
The table below shows the percentage change of Japanese Yen (JPY) against listed major currencies this week. Japanese Yen was the strongest against the Australian Dollar.
| USD | EUR | GBP | JPY | CAD | AUD | NZD | CHF | |
|---|---|---|---|---|---|---|---|---|
| USD | 0.32% | 0.46% | -2.19% | 0.78% | 2.25% | 2.20% | -0.74% | |
| EUR | -0.32% | 0.14% | -2.54% | 0.40% | 1.96% | 1.81% | -1.11% | |
| GBP | -0.46% | -0.14% | -2.77% | 0.27% | 1.80% | 1.66% | -1.26% | |
| JPY | 2.19% | 2.54% | 2.77% | 3.08% | 4.61% | 4.44% | 1.43% | |
| CAD | -0.78% | -0.40% | -0.27% | -3.08% | 1.55% | 1.41% | -1.51% | |
| AUD | -2.25% | -1.96% | -1.80% | -4.61% | -1.55% | -0.15% | -3.03% | |
| NZD | -2.20% | -1.81% | -1.66% | -4.44% | -1.41% | 0.15% | -2.84% | |
| CHF | 0.74% | 1.11% | 1.26% | -1.43% | 1.51% | 3.03% | 2.84% |
The heat map shows percentage changes of major currencies against each other. The base currency is picked from the left column, while the quote currency is picked from the top row. For example, if you pick the Japanese Yen from the left column and move along the horizontal line to the US Dollar, the percentage change displayed in the box will represent JPY (base)/USD (quote).